Explore common questions and troubleshooting tips concerning Alchemer's Standard Report.
What is the Standard Report?
The Standard Report is the most commonly used report in Alchemer. It is an aggregate report and also serves as the default reporting option for your surveys.
- The Standard Report provides charts, tables, word clouds, and other elements that help convey your data visually.
- Data can be filtered according to date, specific question answers, or location (just to name a few)
- Create segments to see your data across different populations of respondents, i.e. male vs. female
- Download your Standard Report as a PDF or as a Word, Excel, or PowerPoint document
- Customize the Standard Report's look & feel/branding and choose from a number of charting options
Visit our expanded documentation for an introduction into the Standard Report.
How does the Report User License work?
In Team & Enterprise Accounts, the report user license was designed to allow users (coworkers, stakeholders, etc.) to access reports but not build surveys in your account. Use this license to ensure that everyone in your organization is in the know.
Access the expanded documentation to see what a Reporting License User can expect to see when they log into their account.
How do I update the data in my Standard Report?
The Standard Report automatically updates with new responses; this is one of the biggest advantages that the Standard Report has over the Legacy Summary Report.
Important Notes About the Data That Displays in Your Standard Report
- Old test data, that is, test data that was created prior to the release of the Standard Report (03/22/2015) will not display in your report.
- The initial indexing of responses might take a few moments. Click the link to View a Snapshot link if you simply cannot wait to jump in.
- Once your report has loaded, there will be a 1 to 5-minute caching delay on pulling new responses or edits to responses.
What chart types are available within the Standard Report?
The Standard Report provides access to more than 30 different reporting elements! All survey questions have a default chart/report element, but most of these can be customized.
Explore the various chart types and reporting elements here. Click on the chart-specific articles to learn what survey questions/features are compatible with the specific chart/reporting element.
How do I change the chart type of my question/report element?
Within your Standard Report, locate the question/report element for which you want to change the chart and click the corresponding Chart Type link.
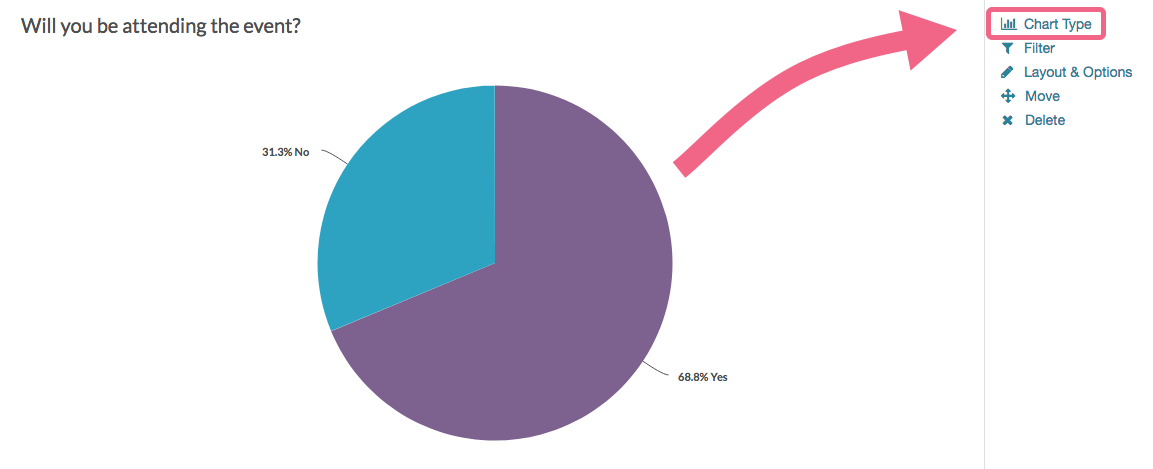
Compatible chart types will be available via either the Overall (Aggregate) Charts or Over-time (Longitudinal) Charts sections. Make your chart selection and make sure to Save the element when you are done.
Learn more about Longitudinal Reporting.
What other elements can be added to the Standard Report?
There are a number of non-question data elements that can be added to your Standard Report using the insert tool:
- DIY Grids/Cards - Use the DIY Grid or Cards to group data by response.
- Text or Image Element - Use the Text / Image Element to add text or images throughout your report to help report reviewers better understand the data.
- Response Map - The map will show dots for locations where responses were recorded.
- Response Table - Include Individual Responses in the Standard Report.
- Response Timeline - Track your responses over time.
- Email Campaign Statistics - If you have used an Email Campaign to distribute your survey, you have the option to include Email Statistics in your report.
- Quotes - Within individual responses, you can highlight portions of the text that are particularly relevant to your project as quotes to be used in final reports. The Quotes reporting element will pull the quotes you've highlighted.
- URL Variables, SSO, Hidden Values - Add a report element for values passed in via URL variables , Hidden Value Actions , or for SSO Attributes passed in via the SSO Authentication for survey respondents feature.
- Device Chart - Include statistics on the number of respondents based on the type of device – desktop, tablet, or mobile.
- The R Script Action is currently disabled while we work on a new way to access the power of R Script through the Alchemer platform. R Script - You can use R scripts in Alchemer's Standard Report. The scripts (if so enabled) can be used in any Standard Report, and will honor the report's settings, styles, and filters.
I customized Reporting Values in my survey, can I use those in my Standard Report?
Yes, this can be done globally in the Standard Report by going to Report Options > Answer Options and selecting Reporting Values under Answer Option Names.

You can also toggle this setting on a question-by-question basis by clicking the Layout & Options link on the element you wish to change within the report. Select Reporting Values under the Answer Option Names section.
How do I rename my Standard Report?
Are you looking to rename your Standard Report? Click directly on the report title at the top of your report and simply update the existing title with the new title.

What are my options for sharing the Standard Report?
The Standard Report can be shared as a link and can also be emailed. The emails can be set to send the report on a recurring schedule or as one-time sends.
After creating, customizing, and styling your Standard Report click the Share Report option in the upper right of your report to get started with sharing.
First, you'll have a Shareable Link available should you need to share your Standard Report online. You also have the option to Customize this link where you can choose between a default, branded subdomain or private domain link. Learn how to make sure that all report links use your private domain by default (requires Account Administrator privileges).
Want a preview of what viewers will see when you send out this link? Click View to get a preview of the report itself.
Below the Shareable Link you'll have a link to Embed on your website. If you click this link you'll be provided with a JavaScript Embed Code you can use to embed the report right on your website! To do so copy the Embed Code and paste it on your website.

Learn about further sharing options by visiting the expanded documentation.
Can I download a hard copy of my Standard Report?
Yes, there are a number of download options available. Standard Reports can be downloaded as a PDF or as an Excel, Word, or PowerPoint document. Legacy Summary Reports can be downloaded as a PDF, Word, PowerPoint or Excel document.

Standard Reports
Standard Reports can be downloaded as a PDF or Excel, Word, or PowerPoint document.
PDF Download
The PDF download will look most like your report as you see it in Alchemer.
When downloading a PDF version of a Standard Report, you can choose these options:
- Insert a page break after each question
- Include page numbers
- Include lists of open text answers


Learn about the other download options that are available within the Standard Report (including Word, Excel, and PowerPoint) by visiting the expanded documentation.
My Standard Report has Test Data, can I exclude it?
If your survey has collected test responses via the Generate Test Responses or via manual testing, you will see the following notification within your Standard Report.
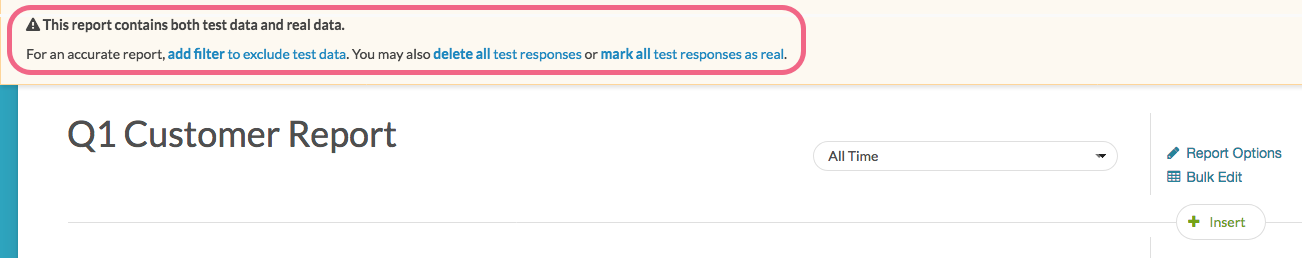
While you can dismiss this notification via the x in the upper right, there are a few helpful options available here that can be big time-savers.
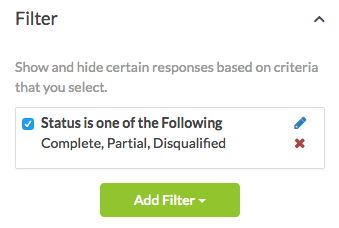
Add filter to exclude test data
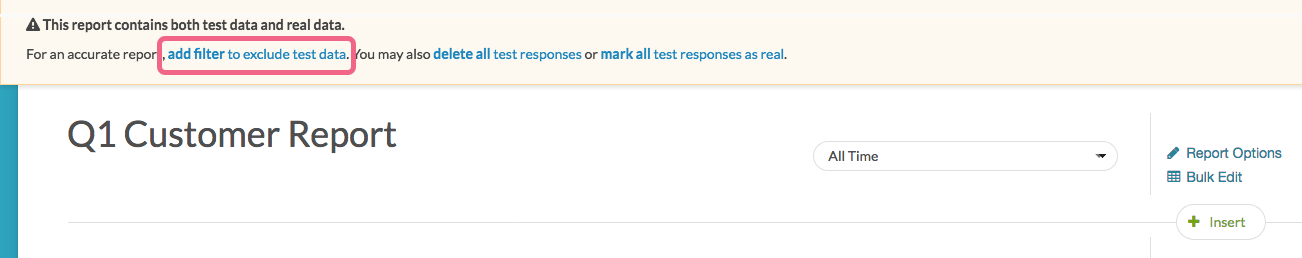
Click this option and a filter will be applied to your Standard Report to only include Complete, Partial, and Disqualified responses. You can adjust or remove this filter if needed.
What are my filtering options within the Standard Report?
There are many reasons why you may not want to include all of your data in a Report. You may only want to see people who answer a specific question a certain way or data from a certain date range. You can do this using report filters.
Check out our Filter Export Data Tutorial to learn about Export filtering.

Filter a Standard Report
Filtering a Standard Report is easy as pie. You can filter by question answers, response status, response IDs and survey links. You can also create advanced filters with multiple conditions and/or groups of conditions. Finally, if you wish to filter by the date responses were recorded check out our Filter by Date Tutorial.
- Learn about your filtering options in detail by visiting the expanded documentation.
- Learn about date filtering within the Standard Report, here.
- If you want to apply a filter to a specific question, follow the steps here.
How do I include Partial Responses in my Standard Report?
Our Standard Reports will include Complete, Partial, Disqualified, and Test data by default. To override this:
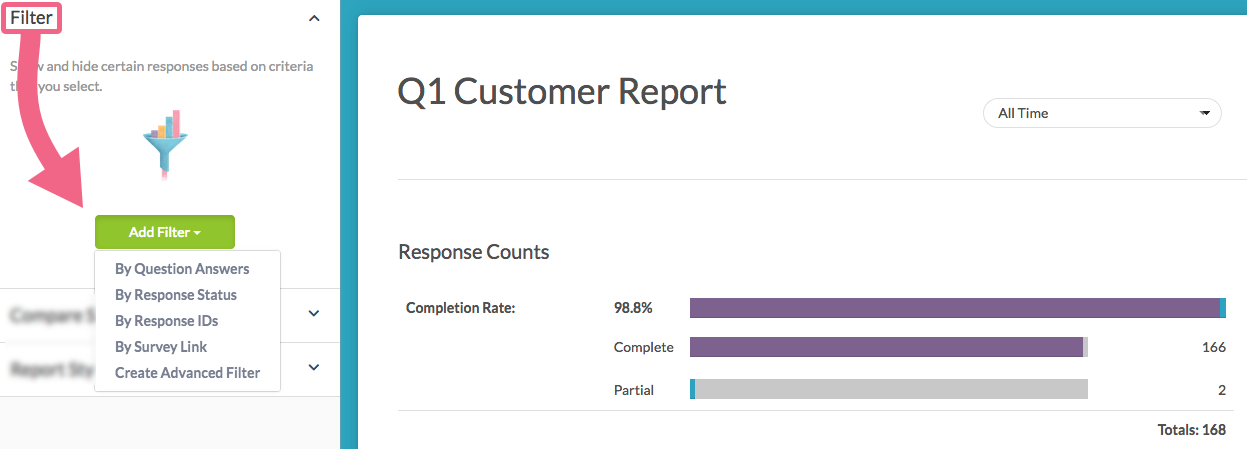
- Click on the Filter option in the left-hand panel
- Click Add Filter and select the By Response Status option.
- Last, uncheck the response status/es you wish to exclude. Click Save Filter when you are finished.


Visit the expanded documentation for steps using other reports types.
Can I combine data from multiple surveys within one Standard Report?
Looking to report on data from multiple surveys in a single report? We have a reporting feature in the Standard Report that allows you to include the data from multiple identical surveys in a single report.
Setup
- Create a Standard Report on any one of your identical surveys and click Combine Results located in the upper right-hand corner of your report.
- In the search field provided enter either the survey name or ID and select the correct survey when it appears in the menu. You can repeat this for multiple surveys if you wish.
Note: The survey construction must be identical. Data is combined using Question IDs - simply having a question that is worded the same across surveys will not work if the Question IDs are not identical.

What are segments and when should I use them?
Using Segments in the Standard Report you can compare subgroups within your data. Typically, segments are groups within your data that you would like to make comparisons across. For instance:
- segments comparing males and females
- segments to see how responses differ across different age groups i.e., 18 and under vs. 65 and over
- segments to see how NPS® Promoters respond vs. how Detractors respond
Segments can be set up using questions in your survey, response status, response IDs and survey links. You can also create advanced segments with multiple conditions and/or groups of conditions.
As shown below, you might compare responses for males vs. females or you could compare how a question of interest breaks down across the rest of the questions in your survey.

Visit the expanded documentation for setup instructions, customization options, and question compatibility.
Can I Recode Answers?
Yes, the Answer Grouping feature within Standard Reports allows you to group answer options for reporting purposes. This functionality allows you to do what is often referred to as "recoding" in data preparation parlance.
A common use case for grouping answer options is Top and Bottom Box Scoring but this feature can be used for all sorts of analysis and reporting needs.
There are two methods for grouping answer options in Alchemer Standard Reports:
- Answer Grouping/Top and Bottom Box - create groups/categories and choose the answer options that fall into each category.
- Merge Duplicate Reporting Values - automatically combine answer options within a single question that have identical reporting values.
How do I show changes in data over time?
Longitudinal reporting allows you to view data for your survey questions over time. Using longitudinal reporting you can get a sense for data trends in your longer running surveys.

Setup
- Within your Standard Report, locate a compatible question element.
- Click the Chart Type option to the right of the chart.
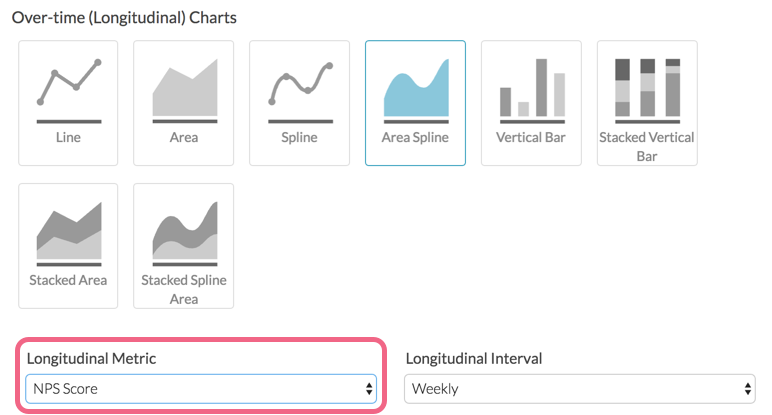
- Select an available chart from the Over-Time (Longitudinal) Charts section of the Chart Types

- Select the desired Longitudinal Metric that you want to plot. Longitudinal charts will default to show the option counts.
 The following Longitudinal Metrics are available:
- Option Count (default) - plots a data point for each answer option of the question
- NPS® (NPS Question only) - plots the score calculated when using the NPS® question
- Sum* - plots the Sum - computed by multiplying the number of responses for each option by its numeric reporting value and summing - Learn More!
- Average* - plots the Sum divided by the Total Responses (great option for showing over-time changes for rating questions such as Likert Scales)
- Min* - plots the minimum value selected across all responses
- Max* - plots the maximum value selected across all responses
- Standard Deviation* - plots the standard deviation - a measure of variation
- Variance - plots variance which measures how far a set of (random) numbers are spread out from their mean
- Total - plots the total responses to the question
- Hidden - plots the total responses that did not answer the question regardless of logic conditions that prevented the question from being seen
- Skipped - plots the total responses who saw the question but elected to move past without answering (question must not be required)
*Numeric Reporting Values are required.
Learn more about Statistics within the Standard Report by visiting the documentation.
- Customize the Longitudinal Interval. Longitudinal charts will default to display on a weekly basis. The following intervals are available:
- Daily
- Weekly
- Monthly
- Annual


 The following Longitudinal Metrics are available:
Learn about the available Longitudinal Chart Types by visiting the expanded documentation.
Can I include statistics in my Standard Report?
There are a number of statistics that can be included in your Standard Report. Once added, statistics are available for most questions within the report and are presented as a table below the question.
Available Statistics
The following statistics are available within the Standard Report:
- Sum - The sum is computed by multiplying the number of responses for each option by its numeric reporting value and summing. Available for questions with numeric reporting values.
- Average - Average is the Sum divided by the Total Responses. Available for single select questions with numeric reporting values.
- Min - The minimum value selected across all responses. Available for questions with numeric reporting values.
- Max - The maximum value selected across all responses. Available for questions with numeric reporting values.
- Standard Deviation - Standard deviation is a measure of variation. Available for questions with numeric reporting values.
- Total Responses - Total responses to the question.
- Hidden Count - Total responses that did not answer the question regardless of logic conditions that prevented the question from being seen.
- Skipped Count - Total responses who saw the question but elected to move past without answering (question must not be required).
Add Statistics Table to All Questions
Statistics can be added to all compatible non-grid questions via Report Options > Layout. Learn about the many settings available via Report Options.

After accessing the Report Options, select Statistics Table. All of the individual metrics that are available will be selected by default. Feel free to pick and choose only those that you need by de-selecting any metrics that you don't want to include. Click Save to apply your settings.

If you have chosen to add all available statistics, the following statistics table will be included below your response table:

If you want to add statistics to only specific reporting elements, find the instructions here.
How is the score computed for Ranking Questions?
Both Ranking Grid and Drag & Drop Ranking questions report a Score which is used to determine how items are ranked in the report. Wondering how this score is computed? You're in the right place!

- The score is a weighted calculation.
- Items ranked first are given a higher value or "weight."
- The score, computed for each answer option/row header, is the sum of all the weighted values.
- The weighted values are determined by the number of columns, which is usually the same as the number of rows but can be less if using the option to Limit Ranked Items.
Additional details are available within the expanded documentation.
Can I exclude 'Not Applicable' answer options?
Yes, this option is available as an overall report setting. In order to take advantage of this feature within your Standard Report, the Not Applicable special setting will need to be applied to your answer options on the Build tab. Learn how to configure this by visiting the expanded documentation.
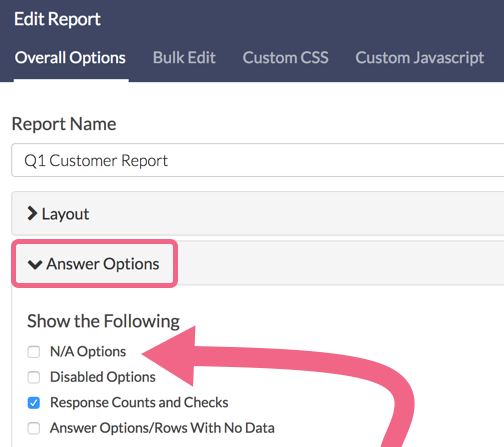
Once you have this special setting applied, within your Standard Report click on Report Options > Answer Options.
De-select the checkbox for N/A options and make any other necessary changes before saving your settings.
What are the customization options for elements within the Standard Report?
The Standard Report allows you to make edits and changes in a couple of different ways, depending on the scope of the changes that you are looking to make:
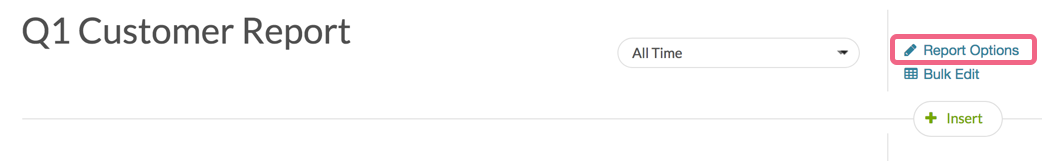
- Use the Report Options and Bulk Edit Elements tools to change settings for all elements in your report at once. Both of these options can be found in the upper right of your Standard Report.

- Use Layout & Options to customize specific report elements on a case-by-case basis. This option is located to the right of any compatible report element.


Learn more about the various options that are available for customizing your Standard Report Elements by visiting the expanded documentation.
How are Custom Tables presented in the Standard Report?
Custom Tables offer several unique reporting options within the Standard Report that are not available to other Alchemer question types.
Order by Row or Column
Custom Table questions are reported as a single element with separate charts for each sub-question (column) in the table. By default, the sub-question charts are ordered by the table rows, though depending on your preference, can be ordered by column.
Let's consider the following Custom Table, which contains two rows and two columns (sub-questions):

Within the Standard Report, the default reporting for Custom Table sub-questions is to Order by Row (left image). However, you have the option to Order by Column (right image):


Setup
You can change the default setting of Order by Row for all Custom Table questions within your report, or for individual Custom Table elements.
To change the order for all Custom Table questions, click on Report Options > Grid-Type Questions and DIY Tables and toggle the Custom Table Subquestions setting.

To change the order for a specific Custom Table question, click on the Layout & Options link to the right of the table and make your selection under Custom Table Subquestions. Click Save to complete the change.

Why aren't the names, email addresses, and other contact info I collected in my survey displaying in my shared report?
Looking for the names, email addresses and other contact information you collected in your survey to display in your shared report?
Contact information (collected via either the Contact Form or Email question types) is only available for display when using either the Password Protected or Only Logged-in Alchemer Users Privacy Settings. This way you don't mistakenly share your survey respondent's info with the world!

If you are not using one of the above-mentioned share methods, you will see the following notification on the report Share page:

Have your scheduled reports stopped running?
Scheduled report not delivered as expected? Here's one reason it might have stopped:
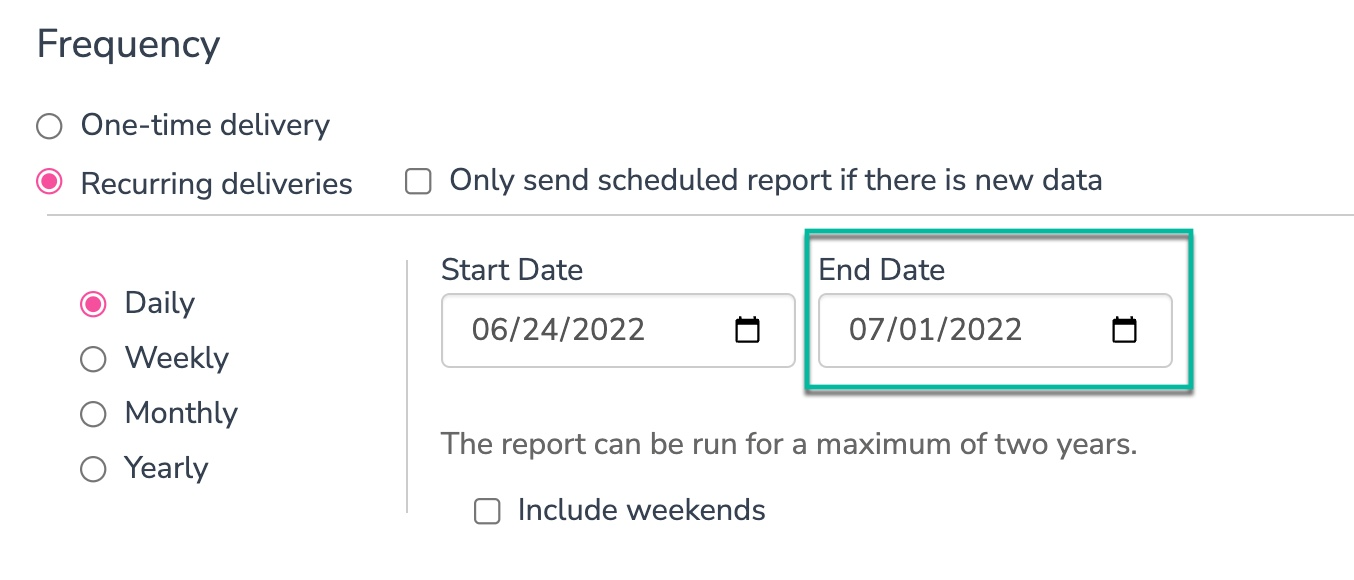
Recurring deliveries can be set to run up to two years before needing to be rescheduled. You will be notified 15 days before your last run via email that you need to reschedule your recurring deliveries. This email will go out to the user who scheduled the report but could possibly be waylaid in your Spam/Junk folder.
To check your scheduled report, go to Results > Reports. Select the report in question then click Share Report and view the End Date in Recurring Delivery section of the Email Report Automatically settings.
We set these limits on the scheduling of reports so we wouldn't have reports that kept running and running long after their usefulness had passed. This scheduling of reports guarantees our system can grow and scale while maintaining the necessary speed.
How does an unanswered Slider question report?
We're asked this question quite a bit in support. Since sliders have a starting value, customers want to know whether this value is recorded if the survey respondent does not interact with the question. The answer is no.
Survey respondents must interact with the slider in order for a value to be recorded.
For example, the below slider question has a starting value of 3. When the respondent clicks on the slider bubble notice how the slider activates by changing color. If the respondent clicks Next or Submit at this point, the starting value would be recorded, however, this is ONLY recorded if the respondent clicks on the question.

Best Practice Tip
If you wish to require that your Slider or Slider List questions are answered we recommend using an NA option to avoid collecting bad data.
Net Promoter®, NPS®, NPS Prism®, and the NPS-related emoticons are registered trademarks of Bain & Company, Inc., Satmetrix Systems, Inc., and Fred Reichheld. Net Promoter Score℠ and Net Promoter System℠ are service marks of Bain & Company, Inc., Satmetrix Systems, Inc., and Fred Reichheld.