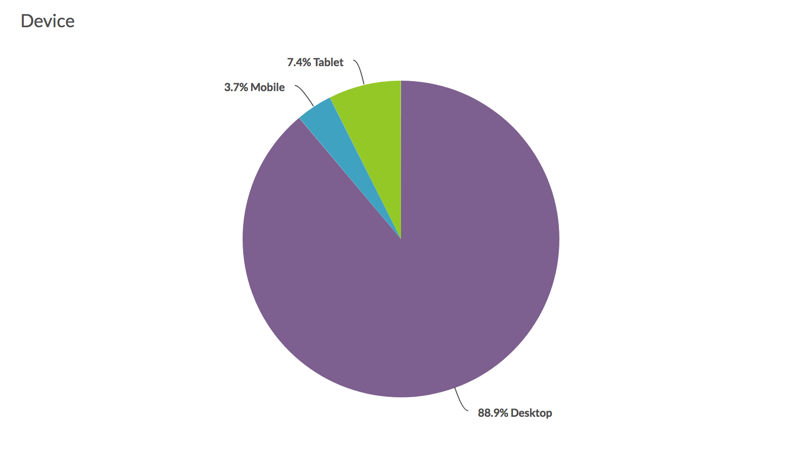
Standard Report: Device Chart
Would you like to include statistics on the number of respondents based on the type of device – desktop, tablet, or mobile – used to respond to your survey? You're in the right place!
- To do so, within a Standard Report simply click the Insert button between any two charts where you wish to add your device chart.
- Select the Device Chart option from the dropdown menu. A pie chart showing the device breakdown will be added to your report.
The added chart will be titled Device.
- Click the corresponding Chart Type link to customize the chart title.
- Click the corresponding Filter link to filter the data displayed within the Device Chart.