R Script Action is now deprecated and no longer functional.
R is a programming language for statistical computing and graphics. It's used by statisticians, institutional researchers, and data scientists (among others) for modeling and visualizations.
You can use R scripts in Alchemer's Standard Report. The script output can be in the form of:
- Tables
- Text
- Charts
- Custom Visualizations
All rendered in real time!
Create an R Script
Your R scripts must first be added to your R library via Research Library > R Scripts before you can use them in your reports.
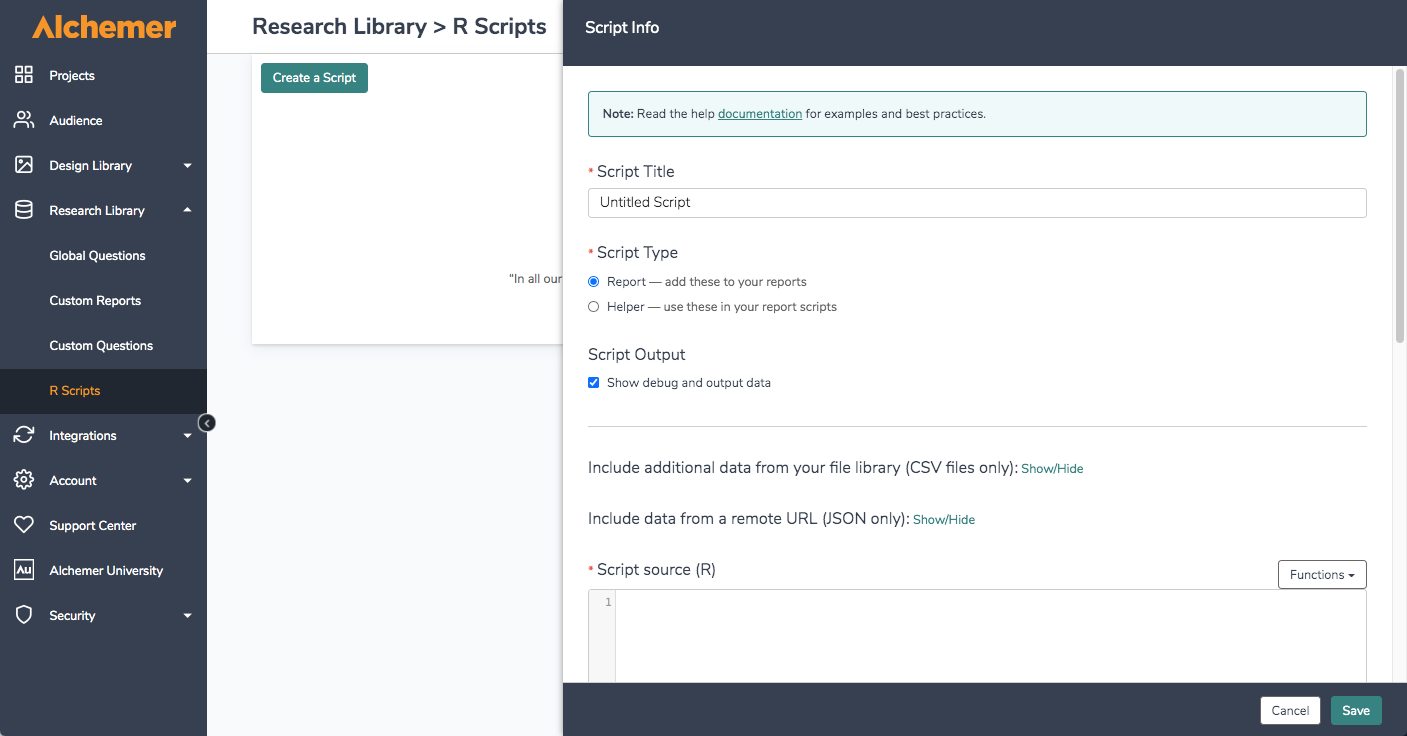
- Click Create a Script to get started.
- Give your script a title.
- Select the Script Type.
- Report scripts can be added to reports.
- Helper scripts can be used in Report scripts and in other Helper scripts. Helper scripts require a Script Alias in order to reference them within a Report script or other Helper scripts.
- Under Script Output you can choose whether you wish to Show debug and output data. This is useful when you are building out your script. You'll want to turn this off once the script is working to ensure debug information does not display in your report.
- (Optional) If you wish to include an external data file in your analysis (say for benchmarking), you can upload it to the file library. Referenced files must be in .csv format.
To use this data in your R Scripts click the Show/Hide link to the right of Include additional data from your file library. Select the external file you wish to include and give it an Alias. External files can be referenced via the sgReadLibraryFile function.
- (Optional) If you wish to reference an external data source in JSON format via URL click the Show/Hide link to the right of the option to Include data from a remote URL (JSON only). Add your URL. You can use the merge code [[SURVEY_ID]] to dynamically reference the survey where the script is run. This can be referenced via the function sgReadRemoteSource.

- Write your R script in the Script source (R) field. See the Alchemer R Script Functions for info on available functions or check out our Working Example.
- Add an associated Charting Script (JavaScript) if needed. See the Charting Functions for info on available functions or check out our Working Example. Click Save to finish creating your R Script.
")


")
Now you are ready to add the R script to your report.
R Settings
You can save survey-level variables to use in your R Scripts under a survey's settings via Results > R Settings. For example, let's imagine you wish to weight your data but your weights vary across surveys as your population varies across surveys. You can use the R Settings to store data like weights or other survey-level data that varies across surveys. In doing so, you can re-use an R Script across surveys and just call in your survey-level data dynamically. Reference these settings in your R Scripts via the sgGetOption function described below.

Add an R Script to your report
- To use an existing R Script in a Standard Report, click the Insert button and select R Script.
- You will be prompted to edit your report element in order to proceed. Click Layout & Options to access your R Scripts.
- Give your R Script report element a Title.
- Select an available R Script from the Select a R Script dropdown menu.
- Click Save to create the element.

You will see a Chart Loading message while Alchemer prepares your element (you may need to refresh). The process may take a minute or two depending on the complexity of the script and the amount of data being compiled.

Alchemer R Script Functions
The following Alchemer functions are available for referencing survey data in R Scripts. Click the function to see parameters and examples below.
- sgGetAllData - Returns raw data for the entire survey for all responses.
- sgGetFilterData - Returns raw data for the entire survey as per the report filter.
- sgGetAllCol - Returns raw data for all responses for the specified column.
- sgGetFilterCol - Returns raw data for the specified column as per the report filter.
- sgGetOption - Used to get a survey-level variable specified in Results > R Settings.
- sgAddChart - Makes data available for charting. There is no return, instead, data available for use via the Charting Functions.
- sgGetSourceName - Loads a helper R script.
- sgReadLibraryFile - Loads a data file (.csv) uploaded to the File Library and specified in your script setup.
- sgReadRemoteSource - Loads an external data file (JSON) specified in your script setup.
sgGetAllData
Returns raw data for the entire survey for all responses.
Example
sgGetAllData()
The return will be a matrix of data for all survey questions for all responses. The return for question data will be the reporting value, if present, for the selected answer. Otherwise, the option SKU for the selected answer will be returned.
sgGetFilterData
Returns raw data for the entire survey as per the report filter.
Example
sgGetFilterData()
The return will be a matrix of data for all survey questions for all responses that correspond to the filter applied to the report. The return for question data will be the reporting value, if present, for the selected answer. Otherwise, the option SKU for the selected answer will be returned.
sgGetAllCol
Returns raw data for all responses for the specified column.
| Parameters | Description | Required |
|---|---|---|
| column | the column of data you wish to return (string) | true |
| Possible Values | Example |
|---|---|
| ResponseID | sgGetAllCol('ResponseID') |
| Question's SPSS variable name | sgGetAllCol('nps') |
| Column ID (this is the column for the question returned via sgGetAllData; it is the Question ID with a prefix of X) | sgGetAllCol('X2') |
Examples
Get ResponseIDs:
sgGetAllCol('ResponseID')The return will be a list of response IDs from the survey.
[1] 1 2 3 4 5 6 7 8 9 10
To get question data you can do so using either the SPSS variable name assigned to the question or the Column ID (this is the column for the question returned via sgGetAllData; it is the Question ID with a prefix of X).
sgGetAllCol('X2')
sgGetAllCol('nps')
The return for question data will be the reporting value, if present, for the selected answer. Otherwise, the option SKU for the selected answer will be returned.
  [1]  9  0  7 10  2 NA  9 NA  8 10  3  3  6  6  2  8 NA  9  2  7  6  0  7 NA  2
 [26]  6  6  7  2  8  0  8  7  5  0  1  1  4 NA  3  4  0 10  7  0  4  1  5 10  8
 [51] NA  3  2  5  5 NA  9  3  6  2  3 10  2  5  7 10 NA  5  1  5  2  1  0  5  0
 [76]  5  9 10  7  7  1  1  8  5  0 10  3  4 NA  0  1  5 NA  1  1  0  0  0  7  6
[101]  5  3 10 NA  8  9  3  0  2 NA
sgGetFilterCol
Returns raw data for the specified column as per the report filter.
| Parameters | Description | Required |
|---|---|---|
| column | the column of data you wish to return (string) | true |
| Possible Values | Example |
|---|---|
| ResponseID | sgGetFilterCol('ResponseID') |
| Question's SPSS variable name | sgGetFilterCol('nps') |
| Column ID (this is the column for the question returned via sgGetAllData; it is the Question ID with a prefix of X) | sgGetFilterCol('X2') |
Examples
Get ResponseIDs:
sgGetFilterCol('ResponseID')The return will be a list of filtered response IDs from the survey.
[1] 1 4 7 10 18 43 49 57 62 66 77 78 86 103 106
To get question data you can do so using either the SPSS variable name assigned to the question or the Column ID (this is the column for the question returned via sgGetAllData; it is the Question ID with a prefix of X).
sgGetFilterCol('X2')
sgGetFilterCol('nps')
The return for question data will be the reporting value, if present, for the selected answer. Otherwise, the option SKU for the selected answer will be returned.
[1] 9 10 9 10 9 10 10 9 10 10 9 10 10 10 9
sgGetOption
Use to fetch your survey-level variables as specified in Results > R Settings. Learn more in the R Settings section of this tutorial.
| Parameters | Description | Required |
|---|---|---|
| key | the key specified in Results > R Settings in your survey | true |
Example
sgGetOption('gender')The return will be the corresponding value as defined in the surveys R Settings.
sgAddChart
Makes data available for charting. This function does not return anything, instead, it makes data available for use with the Charting Functions.
| Parameters | Description | Required |
|---|---|---|
| title | the title of the chart (string) | true |
| categories | the categories you are charting (vector) | true |
| values | the values that correspond to the categories (vector) | true |
Example
categories <- c('cat', 'dog', 'bird')
values <- c(5, 10, 15)
sgAddChart('Pets', categories, values)
sgGetSourceName
Loads a helper R script.
| Parameters | Description | Required |
|---|---|---|
| script_alias | the alias of the helper script (string) | true |
Example
source(sgGetSourceName('helper_script'))sgReadLibraryFile
Loads a .csv file from the file library. The list of .csv files that can be loaded is set within the script setup; see step 5 in the Create an R Script section of this tutorial.
| Parameters | Description | Required |
|---|---|---|
| alias | the alias script setup | true |
Example
sgReadLibraryFile('mydatafile')sgReadRemoteSource
Loads JSON from a remote source as specified in the script setup; see step 6 in the Create an R Script section of this tutorial.
Example
external = sgReadRemoteSource()
print(external)
The JSON will be transformed to an R list for use in your R scripts.
$answer
[1] "no"

$forced
[1] FALSE

$image
[1] "https://mydomain.com/assets/0-b6d3e555af2c09094def76cf2fbddf46.gif"
Charting Functions
The following Alchemer functions are available for charting the data from your R Script.
- SG.getData - Returns the data saved via the sgAddChart function.
- SG.addChart - Creates a chart using the data made available in the R script via the sgAddChart function and fetched via the SG.getData function.
- SG.save - Saves the charts created via SG.addChart.
SG.getData
Fetches the data saved via the sgAddChart function.
Example
var charts = SG.getData();
console.log(charts);
The data from the above sgAddChart example would look like so:
[{ k: 'NPS Score',
    c: [ 'Detractors', 'Passives', 'Promoters' ],
    v: [ 56, 18, 19, -39.8 ]
}]
SG.addChart
Creates a chart using the data made available in the R script via the sgAddChart function and fetched via the SG.getData function. Format data according to Highcharts (see https://www.highcharts.com/demo for examples of charts). This function must be followed by the SG.save function in order to create a chart.
Example
// 1. Fetch the data sent over via the sgAddChart function
var charts = SG.getData();

// 2. Store data from SG.getData object in variables for use in Highcharts
var chartTitle = charts[0].k;
var seriesValues = charts[0].v;
var seriesCategories = charts[0].c;

var detractors = seriesValues[0];
var passives = seriesValues[1];
var promoters = seriesValues[2];
var score = seriesValues[3];

// 3. Create a chart using Highcharts
SG.addChart({
    chart: {
        type: 'bar'
    },
    title: {
        text: chartTitle +': ' + score
    },
    yAxis: {
        min: 0,
        title: {
            text: 'Percent'
        }
    },
    legend: {
        reversed: true
    },
    plotOptions: {
        series: {
            stacking: 'percent'
        }
    },
    series: [
        {
        name: seriesCategories[2],
        color: "#5AB2A5",
        data: [promoters]
    	},
      	{
        name: seriesCategories[1],
        color: "#ffcc6f",
        data: [passives]
    	},
        {
        name: seriesCategories[0],
      	color: "#FF6666",
        data: [detractors]
    }]
});

// 4. Save the chart
SG.save();
The above charting script example yields the following chart output in a Standard Report:
SG.save
Saves the charts created via SG.addChart.
A Working R Script Example
Some customers have requested the ability to change the scale (0-10) of the NPS® question. Many wish to use a 5-point scale. Unfortunately, the scale of the NPS® question cannot be modified; and a different question type (Likert or Radio Buttons) cannot be reported on in an NPS® format. This is a great use case for R Scripts!
In this example, we'll take the data from a 5-point Likert (Rating) question and create a custom NPS chart. For the purpose of example, we'll also pull in some external data to demonstrate how this works.
R-Script functions used in this example
Setup
To get started, we'll create a 5-point Likert(Rating) question with our NPS question text.

Add nps to the SPSS Variable Name field on the Logic tab.

Next, we'll create an R Script via Research library > R Scripts.

In the Script source (R) field we'll write the below script. Here is a high-level overview of the steps in this script:
- This script gets the data from the survey using the sgGetAllCol function.
- In the second step we fetch the data from a file we uploaded to the file library using the sgReadLibraryFile function.
- The two data sources are combined into a single vector.
- Next, we loop through the combined data vector to compute aggregate counts of promoters (5), passives (4), and detractors (1-3).
- Then we compute the NPS score by subtracting the percentage of detractors from the percentage of promoters.
- Finally, we make the data available for charting using the sgAddChart function.
# ----- 1. Fetch survey data ----- #
nps_survey <- sgGetAllCol('nps')

# ----- 2. Read external data and append to survey data ----- #
external = sgReadLibraryFile('external')
nps_external = external[,2]

# ----- 3. Combine survey data and external data into a single vector ----- #
combined = c(nps_survey,nps_external)

# ----- 4. Loop through combined data vector and increment counts ----- #
promoters = 0
detractors = 0
passives = 0

for (i in combined) {
  if (!is.na(i)) {
    if  (i <= 3) {
      detractors = detractors + 1
    }
    else if (i <= 4) {
      passives = passives + 1
    }
    else {
      promoters = promoters + 1
    }
  }
}

# ----- 5. Compute NPS Score ----- #
total <- detractors + passives + promoters
detper <- (detractors/total)*100
proper <- (promoters/total)*100
rawscore <- proper - detper
score <- format(rawscore, digits=1, nsmall=1)
numscore <-(as.numeric(score))

# ----- Make data available for charting ----- #
values <- c(detractors, passives, promoters,numscore)
categories <- c("Detractors","Passives","Promoters")
sgAddChart('NPS Score', categories, values)
Next, we'll add our charting JavaScript in the Charting Script (JavaScript) field. Here is a high-level overview of the steps in this script:
- We start by fetching the data that was sent over via the sgAddChart function using the SG.getData function.
- Next, we store data in the object returned via the SG.getData function into variables for use in Highcharts.
- We then use the SG.addChart function to create a chart using Highcharts.
- Finally, we save the chart using he SG.save function.
// 1. Fetch the data sent over via the sgAddChart function
var charts = SG.getData();

// 2. Store data from SG.getData object in variables for use in Highcharts
var chartTitle = charts[0].k;
var seriesValues = charts[0].v;
var seriesCategories = charts[0].c;

var detractors = seriesValues[0];
var passives = seriesValues[1];
var promoters = seriesValues[2];
var score = seriesValues[3];

// 3. Create a chart using Highcharts
SG.addChart({
    chart: {
        type: 'bar'
    },
    title: {
        text: chartTitle +': ' + score
    },
    yAxis: {
        min: 0,
        title: {
            text: 'Percent'
        }
    },
    legend: {
        reversed: true
    },
    plotOptions: {
        series: {
            stacking: 'percent'
        }
    },
    series: [
        {
        name: seriesCategories[2],
        color: "#5AB2A5",
        data: [promoters]
    	},
      	{
        name: seriesCategories[1],
        color: "#ffcc6f",
        data: [passives]
    	},
        {
        name: seriesCategories[0],
      	color: "#FF6666",
        data: [detractors]
    }]
});

// 4. Save the chart
SG.save();
The resulting chart looks like so:
Net Promoter®, NPS®, NPS Prism®, and the NPS-related emoticons are registered trademarks of Bain & Company, Inc., Satmetrix Systems, Inc., and Fred Reichheld. Net Promoter Score℠ and Net Promoter System℠ are service marks of Bain & Company, Inc., Satmetrix Systems, Inc., and Fred Reichheld.
Scripting and Other Custom Solutions
We’re always happy to help you debug any documented script that is used as is. That said, we do not have the resources to write scripts on demand or to debug a customized script.
If you have customization ideas that you haven't figured out how to tackle, we're happy to be a sounding board for Alchemer features and functionality ideas that might meet your needs. Beyond this, check out our Professional Services; these folks have the scripting chops to help you to achieve what you are looking for!