The Standard Report allows you to make edits and changes in a couple of different ways, depending on the scope of the changes that you are looking to make:
- Use the Report Options and Bulk Edit Elements tools to change settings for all elements in your report at once. Both of these options can be found in the upper right of your Standard Report.

- Use Layout & Options to customize specific report elements on a case-by-case basis. This option is located to the right of any compatible report element.


Report Options
The Standard Report offers a multitude of overall report settings via Report Options. By default, all reporting elements use the overall settings of the Standard Report. Editing an individual element essentially overrides the overall report setting for that element only.

Report Options > Layout
The following overall Layout settings are available:
Filter Details
Filter Details are enabled by default and refer to the notification that is shown if a filter is applied to a specific report element.

Uncheck the Filter Details checkbox to remove these notifications for the entire report.
Chart
Enabled by default, Charts refer to the graphical elements in the Standard Report, such as Pie Charts, Bar Charts, etc. Uncheck the Chart checkbox to hide charts for the entire report. Report elements will display with only the Summary Table as a result.

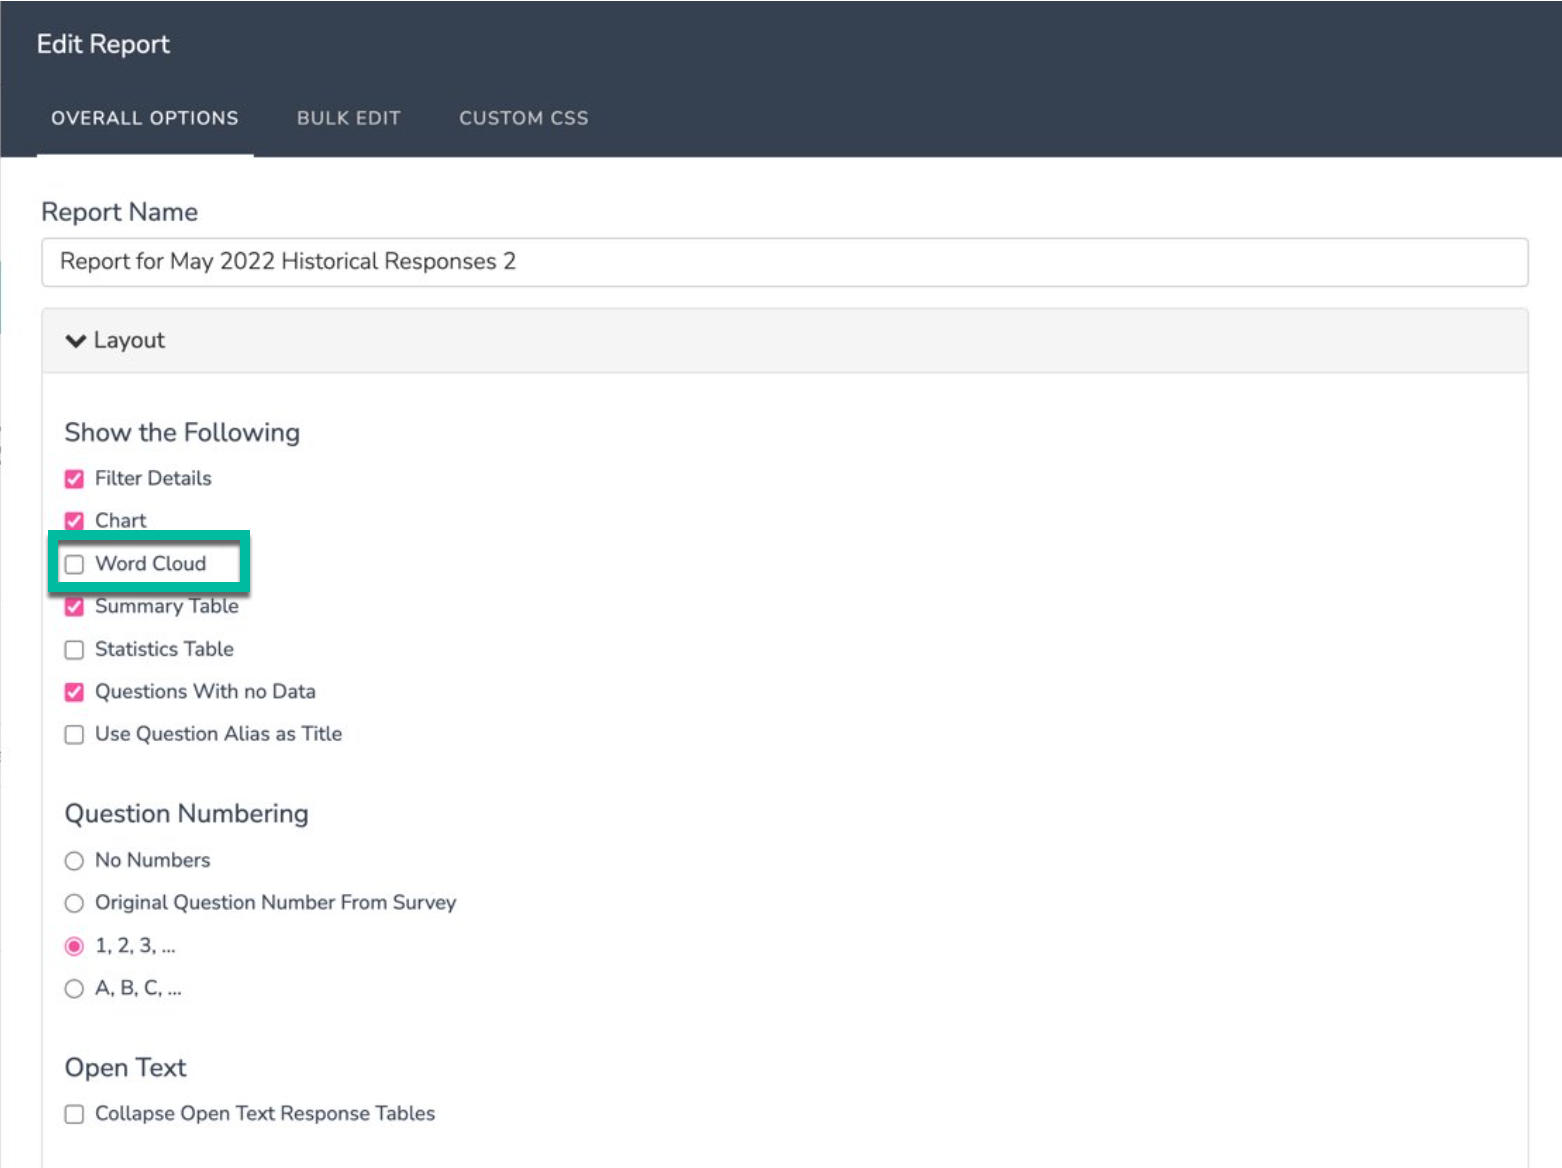
Word Cloud
Word Clouds are hidden by default in Standard Reports. They can be enabled for open text questions by checking the Word Cloud box in the Overall Report Options or the Individual Layout & Options.

Summary Table
Summary Tables refer to the tables that are found as part of most reporting elements. Tables are located directly below the charts and offer a more detailed view of the question's data. Tables are enabled by default.

Uncheck the Summary Table checkbox to remove these tables in your entire report, leaving only the charts for each element.
Statistics Table
The Statistics Table displays compatible statistics for reporting elements. Statistics provided include Average and Standard Deviation. Learn more here. The Statistics Table is disabled by default.

Check the Statistics Table box to include these table for all compatible elements in your report.
Questions With no Data
The Questions With no Data setting allows you to control whether you want to display questions that have not collected any data on your survey. By default, questions with no data will be displayed in your report. Toggle this setting to remove all questions with no data in your Standard Report.
Use Question Label as Title
The Question Label feature allows you to create short names for your survey's question titles (this is particularly useful for reporting purposes if your question titles are long).
The Use Question Label as Title setting allow you to use these short names as titles in your report. Check this setting to use Question Labels for all reporting elements (provided that an Alias was configured on your survey's Build tab). This option is disabled by default.
Question Numbering
By default, the reporting elements in your Standard Report will be numbered starting with 1. You have the option to turn off numbering in the report by selecting No Numbers. If you have customized the numbering of your survey and want to carry that over into your report, select the Original Question Number From Survey option. Last, you have the option to convert numbering into lettering, beginning with the letter A.

Open Text
By default, data collected via open ended text questions displays as an Open Text Response Table.
Under the Layout section of the Overall Options, you can select to show a Word Cloud for all Open Text Answers by default for your entire Standard Report.
Report Options > Answer Options
The following overall settings are available via the Answer Options section.
N/A Options
If you have applied the Answer Option Special Setting of Not Applicable to one of your answer options, you can elect to exclude both this answer option and any associated data from your entire Standard Report.
N/A Options are included by default. Toggle this setting to remove these from your report.
Response Counts and Checks
Response Counts and Checks are included as part of the Summary Table for each reporting element.

Uncheck the Response Counts and Checks checkbox to remove this count from all elements in your Standard Report.
Answer Options/Rows With No Data
By default, any answer options that have not collected data will be omitted from your Standard Report. If you prefer to have these included, check the Answer Options/Rows With No Data box.

Answer Options Names
The Standard Report will display the Original Option Titles within reporting elements by default. If you have customized your reporting values to be unique of your answer option titles and want to display the reporting values in your report, toggle this setting to Reporting Values.
Order Answers By
An answer option within your reporting elements will be displayed in the Original Order it Appeared in the Survey by default. You can toggle this setting to show answers based on the Number of Response (Highest to Lowest) or Alphabetically.

Decimal Places
All percentages in the Standard Report are shown with 1 decimal point by default. Toggle this setting to either 0 (no decimal points) or 2 decimal points.
Report Options > Charts
The following overall settings are available via the Charts section.
Chart Size
The default chart size for Standard Reports is Medium. Toggle this setting to Small or Large depending on your preference.

Axis Values
By default, charts in the Standard Report show axis values as a percentage. If you prefer to see axis values as counts, toggle Option Percents to Option Counts.

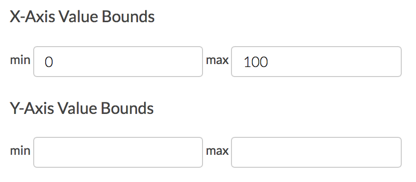
X-Axis/Y-Axis Value Bounds
Use these fields to set the limits (min & max) of your x/y-axes for compatible report elements.
Available for the following chart types:
Group Piped/Repeated Charts by
If you are utilizing Question Piping or Page Piping in your survey, you will see your piped/repeated questions segmented by default. These segments will be grouped based on the Source Option by default. You have the option to group based on the Target Option instead. Learn about the differences between these options here.
Report Options > Grid-Type Questions
The following overall settings are available via the Grid-Type Questions section.
Row Total
The Row Total refers to the number of responses per a given row of a grid question. This is not displayed by default, but can be toggled on for all grids in your report by checking the Row Total box.

Row Average
The Row Average displays an average value calculated across all answer options in a given row. The average will only be available if numeric reporting values have been defined for the grid columns. Row averages are not displayed by default but can be enabled for all grids in your report by checking the Row Average box.

Column Total
Column Total refers to the number of responses for a given column in a grid question. Column totals are not enabled by default but can be displayed for all grids by checking the Column Total box.

Column Average %
The Column Average % displays an average value (as a percentage) calculated across all answer options in a given columns. Column averages are not displayed by default but can be enabled for all grids in your report by checking the Column Average % box.

Custom Table Subquestions
If you have collected data via the Custom Table question type, this data will be displayed via the Order by Row configuration. You have the option to toggle this to Order by Column instead. Learn about the differences here.
Report Options > Report Language
The Report Language section allows you to choose a language for your Standard Report, provided that you have incorporated translations into your survey via the Text & Translations interface.
Report Options > Crosstab
There are a number of overall settings that can be applied to all Crosstab elements within a Standard Report. These settings are covered in detail here.
Bulk Edit Elements
The Bulk Edit settings can be accessed from the upper right of your Standard Report.

Bulk Edit > Element Title
Using the Bulk Edit tool, you can quickly change titles for a number of your reporting elements. Simply click on an existing element title and update the text.

Bulk Edit > Chart Type
Quickly update the chart types for a number of compatible reporting elements. Click on the Chart Type dropdown menu and select from the available options.

Bulk Edit > Move, Copy, Delete
Use the icons in the right hand column to quickly move, copy, or delete reporting elements.

Bulk Edit > Bulk Remove
Use the Bulk Remove option to quickly delete multiple reporting elements.

Bulk Edit > Add another report element
Similar to using the Insert Tool, the Add another report element option allows you to add items such as a Device Chart, Response Map, or Question Chart to your Standard Report.

Layout & Options (Individual Report Elements)
As mentioned above, all reporting elements use the overall settings of the Standard Report by default. Using Layout & Options settings, you can override the overall report settings for a given reporting element.
Many of the settings available for your entire report via Overall Options are available on a per element basis via Layout & Options. Note that depending on the element type, different options will be available.
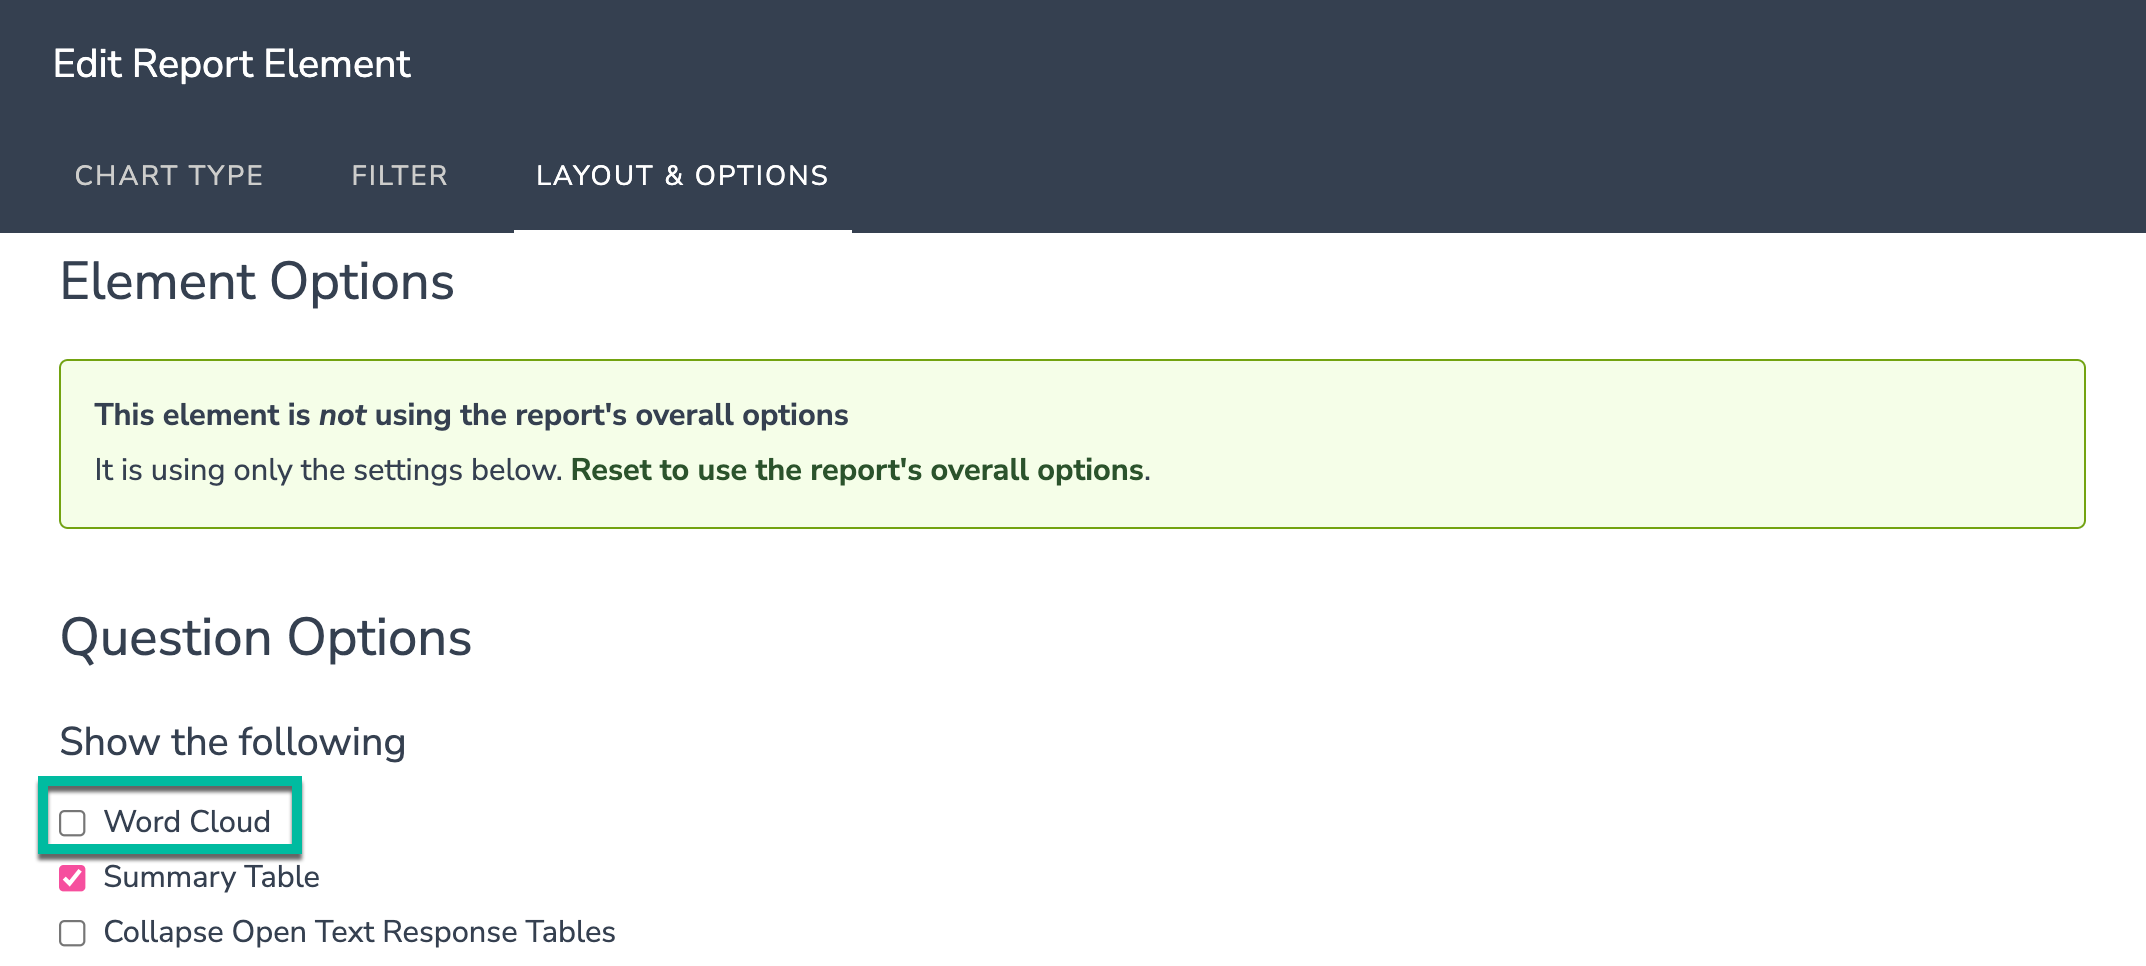
If you update a reporting element via Layout & Options, you will see the following notification within that element:

You will also see the following notification within the body of your Standard Report:

When an individual report element is flagged with this icon, any changes that you make to your Standard Report via Overall Options will not be applied to the element.
Layout & Options > Question Options
The following element-specific settings are available via the Question Options section.
Chart
Enabled by default, uncheck the Chart checkbox to hide the chart for a specific report element. This will hide things like Pie Charts, Bar Charts, etc.
Summary Table
Summary Tables refer to the tables that are found as part of most reporting elements. Tables are located directly below the charts and offer a more detailed view of the question's data. Tables are enabled by default.
Uncheck the Summary Table checkbox to hide this table for the specific report element that you are editing.
Statistics
The Statistics Table displays compatible statistics for reporting elements. Statistics provided include Average and Standard Deviation. Learn more here. Statistics are disabled by default.
Check the Statistics box to include this table for the specific reporting element that you are editing.
Layout & Options > Answer Options
The following element-specific settings are available via the Answer Options section.
N/A Options
If you have applied the Answer Option Special Setting of Not Applicable to one of your answer options, you can elect to exclude both this answer option and any associated data from a specific report element.
N/A Options are included by default. Toggle this setting to remove this from the specific element.
Response Counts
Response Counts are included as part of the Summary Table for each reporting element.
Uncheck the Response Counts checkbox to remove this count from the specific element that you are editing.
Answer Options With no Data (Rows With no Data)
By default, any answer options that have not collected data will be omitted from your Standard Report. If you prefer to have these included, check the Answer Options With no Data box.
Options with no data will be included in your element's Summary Table.
Answer Options Names
The Standard Report will display the Original Option Title within reporting elements by default. If you have customized your reporting values to be unique from your answer option titles and want to display the reporting values for a specific element, toggle this setting to Reporting Values.
Order Answers By
An answer option within your reporting element will be displayed in the Original Order it Appeared in the Survey by default. You can toggle this setting to show answers based on the Number of Response (Highest to Lowest) or Alphabetically.
Chart Size
The default Chart Size for any reporting element is Medium. Toggle this to either Small or Large depending on your preference.
Axis Values
By default, charts in the Standard Report show axis values as a percentage. If you prefer to see axis values as counts for a specific element, toggle Option Percents to Option Counts.
X-Axis/Y-Axis Value Bounds
Use these fields to set the limits of your x/y-axis for this specific report element.

Available for the following chart types:
Layout & Options > Grid Options
The following Grid Options are available when working with grid reporting elements.
Row Total (Grid Questions Only)
The Row Total refers to the number of responses per a given row of a grid question. This is not displayed by default, but can be toggled on for a specific grid by checking the Row Total box.
Row Average (Grid Questions Only)
The Row Average displays an average value calculated across all answer options in a given row. The average will only be available if numeric reporting values have been defined for the grid columns. Row averages are not displayed by default but can be enabled a specfic grid by checking the Row Average box.
Column Total (Grid Questions Only)
Column Total refers to the number of responses for a given column in a grid question. Column totals are not enabled by default but can be displayed for your grid by checking the Column Total box.
Column Average % (Grid Questions Only)
The Column Average % displays an average value (as a percentage) calculated across all answer options in a given columns. Column averages are not displayed by default but can be enabled for a specific grid by checking the Column Average % box.
Layout & Options > Question Options (Open Text Questions)
The following Question Options are available for open text questions.
Word Cloud (Open Text Questions Only)
Word Clouds are hidden by default in Standard Reports. They can be enabled for open text questions by checking the Word Cloud box in the Overall Report Options or the Individual Layout & Options.
By default, data collected via open ended text questions displays as an Open Text Response Table.
Under the Question Options section of Layout & Options, you can select to show a Word Cloud for Open Text Answers.
Layout & Options > Custom Table Subquestions
The following option is available for Custom Table Questions.
Custom Table Subquestions (Custom Table Questions Only)
If you have collected data via the Custom Table question type, this data will be displayed via the Order by Row configuration. You have the option to toggle this to Order by Column instead. Learn about the differences here.
Reset Individual Options to Use Overall Options
If you have customized settings for a specific reporting element and decided that you would rather reset the element to use the overall settings, you have a couple of options.
Access Layout & Options for the specific element and select Reset to use the report's overall option within the notification message.
Another option is to reset from the body of the Standard Report. Hover over the red notification icon and click Reset to Default.
@licenses @everyone