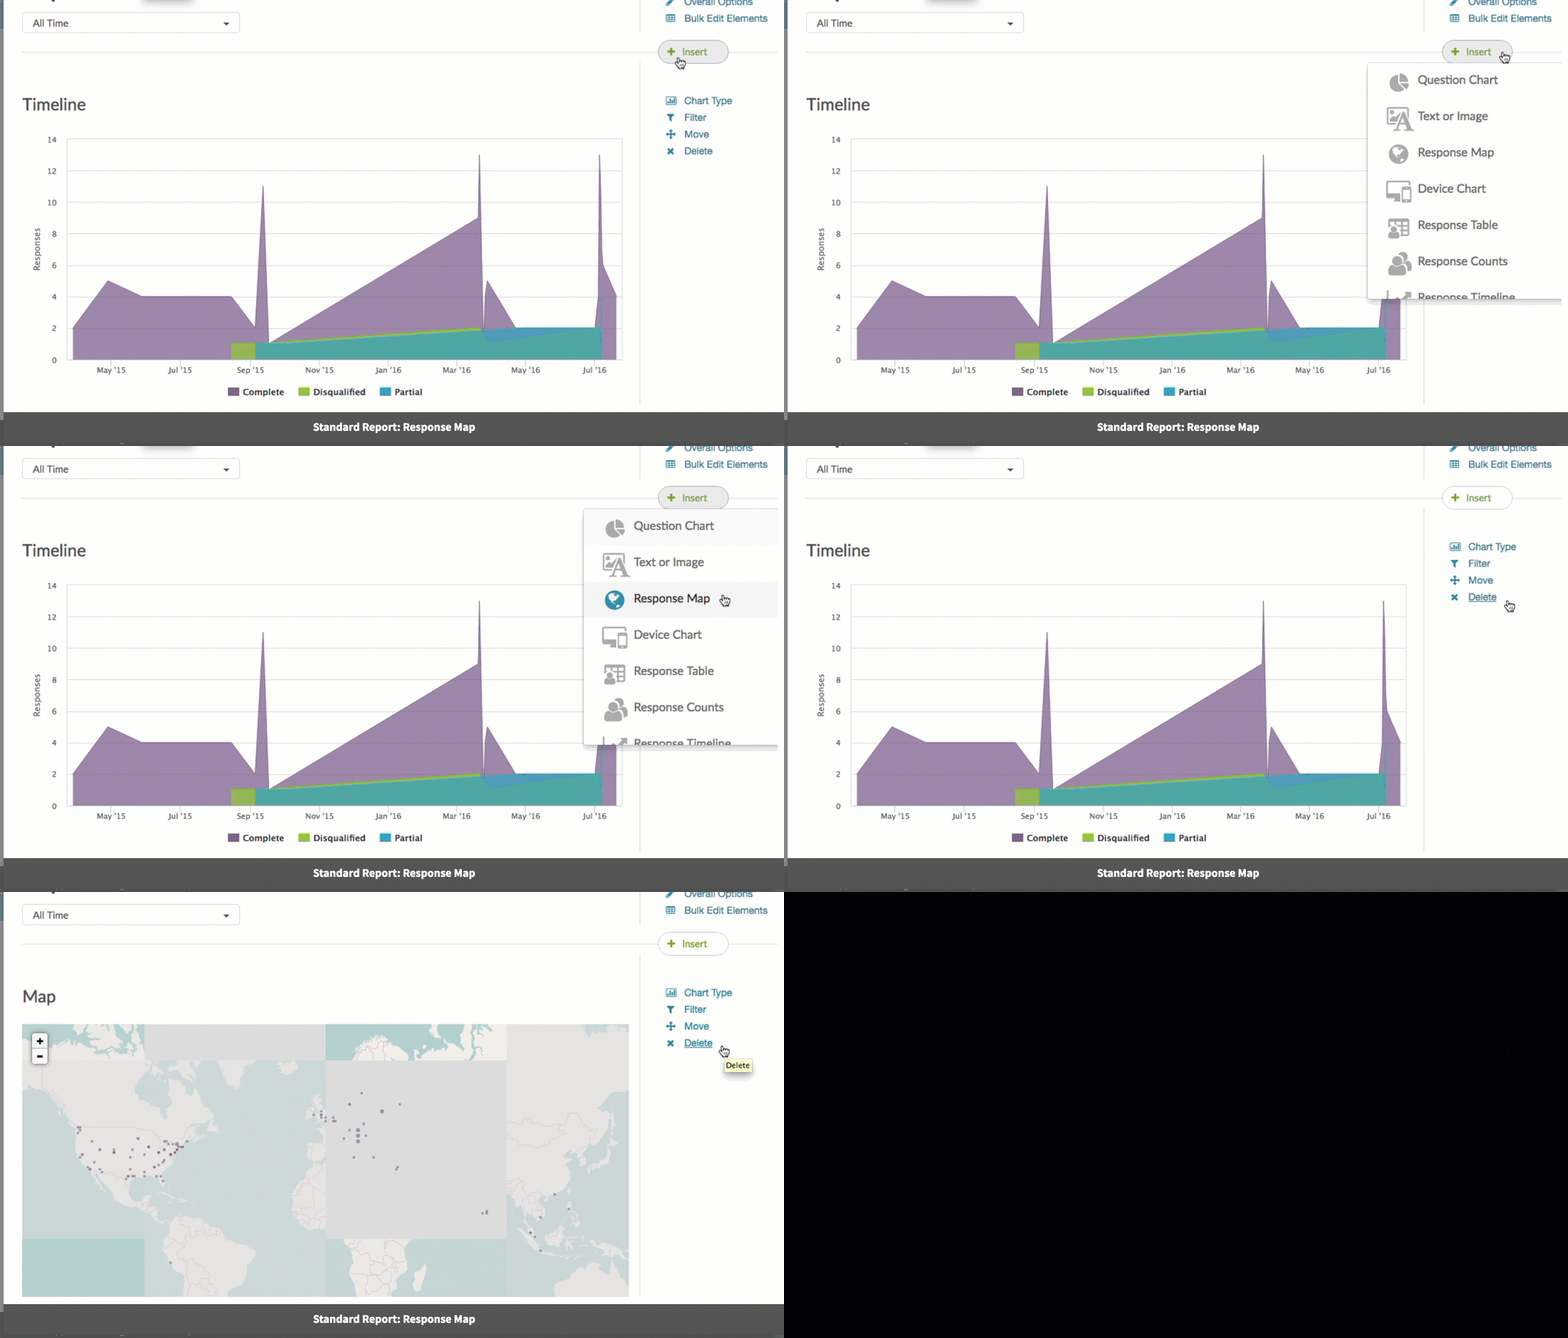
Looking to add a map showing the diversity of all of your respondents? You can easily add a response map using the Insert Tool in the Standard Report, here's how!
To add a map to your Standard Report simply click the Insert button between any two elements where you wish to add your map and select the Response Map option from the dropdown menu.
The map will show dots for locations where responses were recorded. Click on the dots to zoom in. Click the minus sign to zoom back out.
Understanding Response Map Data
The geodata location, which is used to populate response maps, derives the city, state, ZIP code or country from which a person has connected to the Internet by using their device's IP address. Determining which nation a respondent came from based on their IP address is simple and usually very accurate (95%-99%) because registrars require a country name when an IP range is allocated and that information is freely available.
Determining a location down to the city or ZIP code is less accurate and much more difficult. Respondents could be sharing an IP address and ISP's often base their IP addresses in the city where the company is located versus where the respondent actually is.
For example, we are based in Boulder, Colorado and responses generated in our own offices show up in geodata approximately 2.3 miles away!
Filtering Your Map
It is important to note that any date filters you apply to your report will also be applied to the map.