Top and Bottom Box Scoring (also referred to as Top Box, Top 2 (or 3) Box Scores) is a very common way of reporting and analyzing scale questions. The top/bottom boxes are the highest and lowest ratings on a scale question.
For example, if you were to think of a 5-point Likert Scale as being vertically arranged, with the most positive possible rating on the top and the most negative rating on the bottom, the top box scores are the highest rating points on the scale and the bottom box scores are the lowest rating points.
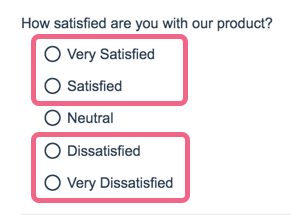
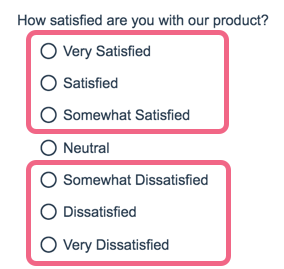
Using the Answer Grouping/Top and Bottom Box tool you can group your answer options to achieve Top Box Reporting.
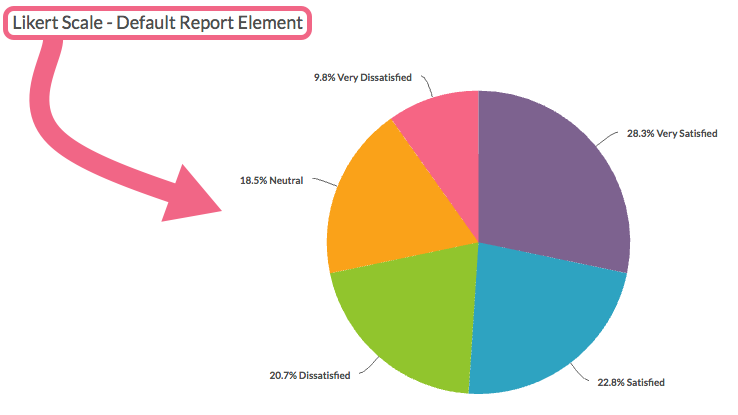
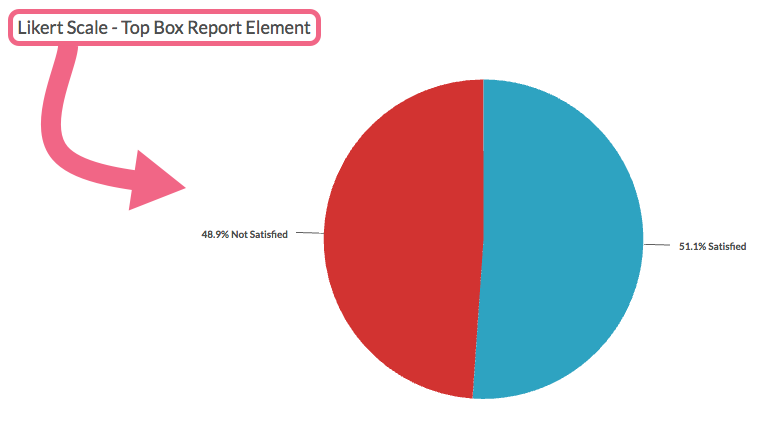
There are two methods for accomplishing Top/Bottom Box Reporting in Alchemer Standard Reports:
- Recommended: Group Answer Options - create groups/categories and choose the answer options that fall into each category.
- Alternative: Merge Duplicate Reporting Values - automatically combine answer options within a single question that have identical reporting values.
The main benefit of using the Answer Grouping tool over the Merge Duplicate Reporting Values option is that Reporting Values do not need to be duplicated. There are a number of implications of duplicating reporting values.
Recommended Method: Group Answer Options
The recommended method for Top/Bottom Box Reporting is to Group Answer Options.
Grouping - Compatible Questions
- Radio Buttons
- Radio Button Grid
- Rating (Likert Scale)
- Checkboxes
- Checkbox Grid
- Dropdown Menu
- Dropdown Menu List
- Image Select (single & multi)
- Net Promoter Score®
- Start by building your Rating (Likert Scale) question(s). Though a number of Alchemer questions are compatible with top/bottom boxing, the most common application is for rating questions such as Likert scales.
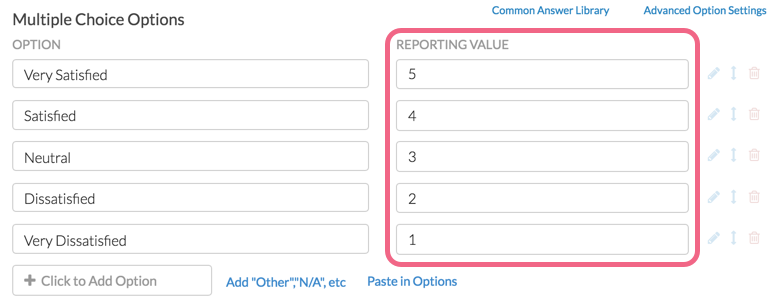
- When adding your answer options, you may want to define your own Reporting Values. Typically, for rating questions like this, numeric reporting values are assigned. Numeric Reporting Values will allow you to take advantage of a number of Standard Report statistics for the question.
- When you are ready to report on your results, go to Results > Reports and create a Standard Report (or access an existing one).
- Locate the reporting element for your Likert Scale question and click Layout & Options.
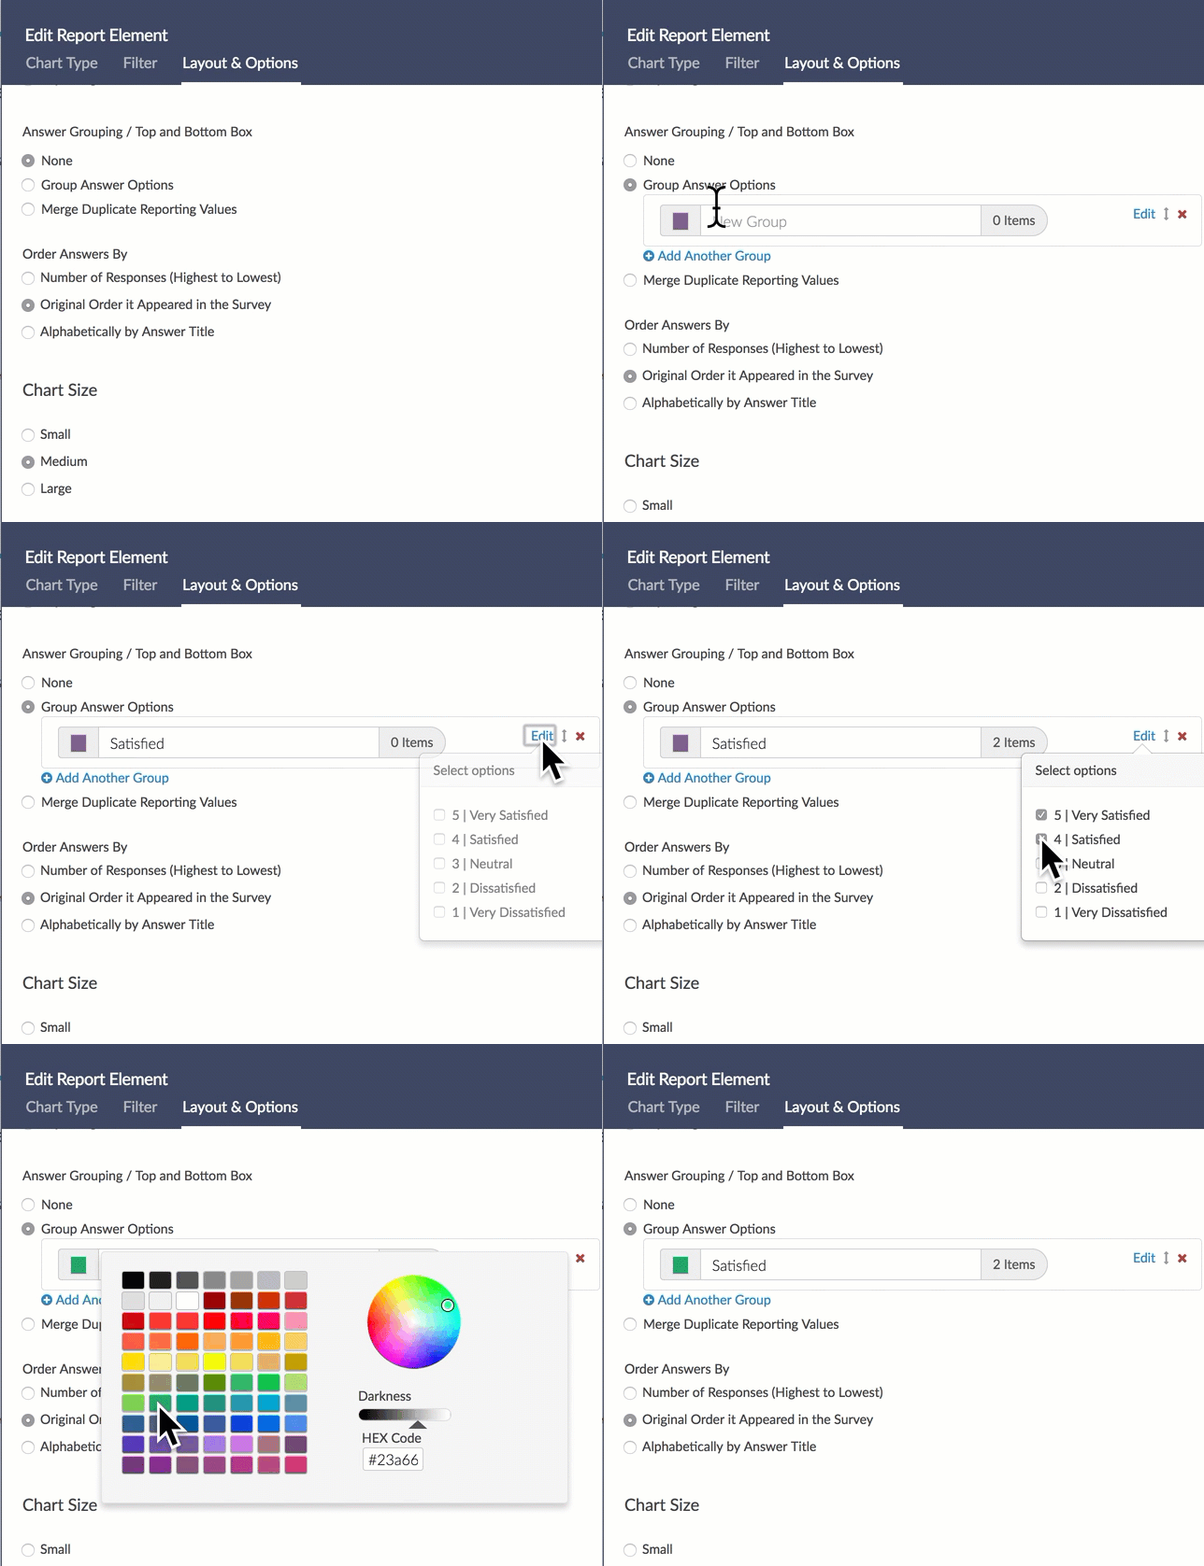
- Scroll down to the Answer Grouping / Top and Bottom Box section. The None (default) option will be selected.
- Click on the option to Group Answer Options.
- You will be presented with a Group Name field. Enter the category name for your Top/Bottom Box here e.g. Satisfied. This name is what will appear as the label on your chart.
- Click Edit to select the answer options that will be grouped together for your Top/Bottom Box reporting.
- Use the color selector to customize the color for the category. This will be the color of group's the pie slice or bar in the report.
- Click to Add Another Group to categorize any remaining items. You can add as many groups as there are answer options in your question (two or three are common). If needed, groups can be rearranged by clicking, holding, and dragging the up/down arrow icon.
- Once you are done adding and customizing your groups, make sure to Save your report element.
Grouping Answer Options Considerations
- Once an option has been added to a group, it cannot be added to another group within the same report element.
- You can add as many groups as there are answer options in your question. If your question is a 5-point rating scale, you will be able to create up to five groups for that report element.
- Grouping Answer Options is a per-element setting. No global report setting is currently available.
Alternative Method: Merge Duplicate Reporting Values
The second method for Top/Bottom Box Reporting is to Merge Duplicate Reporting Values. In order to use this method, you must customize multiple answer options within a question to have the same Reporting Values.
Review the implications of duplicating reporting values.
- Start by building your Rating (Likert Scale) question(s).
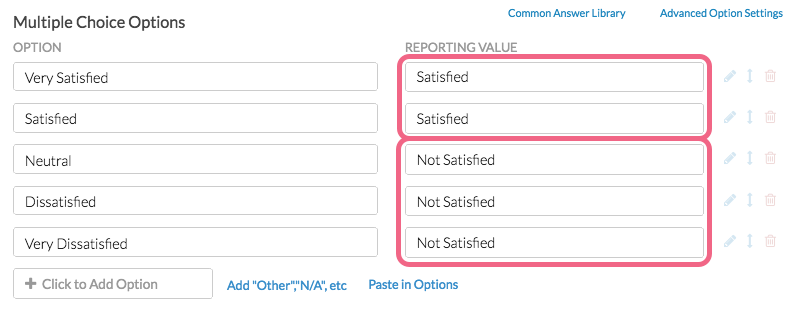
- When adding your answer options define custom Own Reporting Values, giving the top box(es) the same reporting value(s) and the bottom box(es) the same reporting values. In our example:
- Very Satisfied and Satisfied answer options receive the reporting value of Satisfied
- Neutral, Dissatisfied, and Very Dissatisfied all receive the reporting value of Not Satisfied.Note: There are a number of approaches to Top/Bottom Boxing. Some combine the Neutral option with either the top or the bottom category. Alternatively, Neutral can be left as its own (third) category.
- When you are ready to report on your results, go to Results > Reports and create a Standard Report (or access an existing one).
- Locate the reporting element for your Likert Scale question and click Layout & Options.
- Scroll down to the Answer Grouping / Top and Bottom Box section. The None (default) option will be selected. Click on the option to Merge Duplicate Reporting Values and Save.
Your reporting element will now display your Likert Scale data grouped according to the Reporting Values that you provided in Step 2 above.
Duplicate Reporting Value Considerations
- Question Logic and Page Logic are based on reporting values. As such, if multiple answer options have identical reporting values, any logic based on those options will not work as expected.
- If you are planning to use a CSV/Excel Export of your raw data, please note that only the Reporting Values that you specified will be available. If this is the case is a deal breaker use the Group Answer Options tool to group your answer options.
- Using questions that use duplicate reporting values in Quota setup can result in an incorrect number of responses being collected.
- We discourage changing reporting values in live surveys that have already collected data. Make sure to only implement this solution in new surveys. Learn more about Making Changes to Live Surveys.
Net Promoter®, NPS®, NPS Prism®, and the NPS-related emoticons are registered trademarks of Bain & Company, Inc., Satmetrix Systems, Inc., and Fred Reichheld. Net Promoter Score℠ and Net Promoter System℠ are service marks of Bain & Company, Inc., Satmetrix Systems, Inc., and Fred Reichheld.


