Leading Practices and FAQs
Want to see how to take projects from good to great? Check out our Leading Practice & FAQ Home Page!
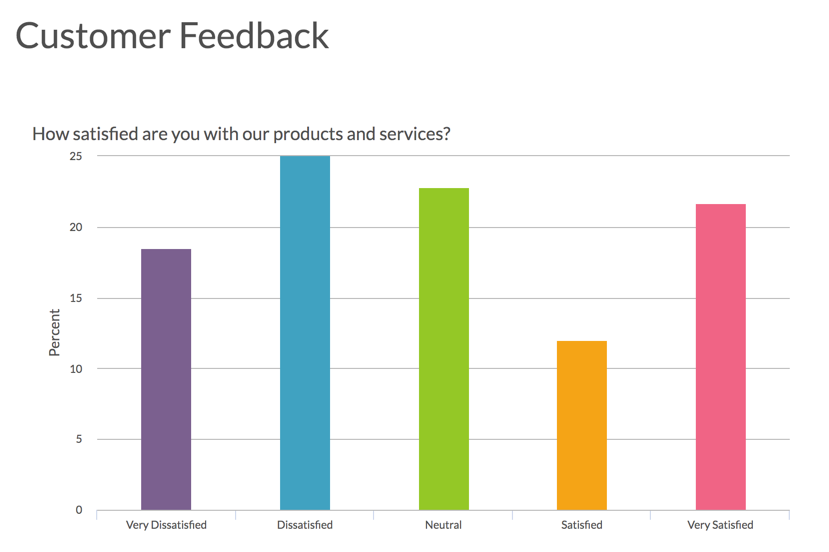
- Standard Report
The Standard Report sets the standard for reporting in Alchemer. The customization possibilities are endless; well maybe not endless, but too many to cover in one tutorial anyway.
In this tutorial we'll overview the various reporting-building tools and some FAQs about display customizations to get you started.
Check out these tutorials that cover other report features in depth:
- Explore Standard Report Chart Types
- Filter the Data Shown in Your Report
- Share, Email, and Schedule Your Report
- Style Your Report
Use the Report Building Tools
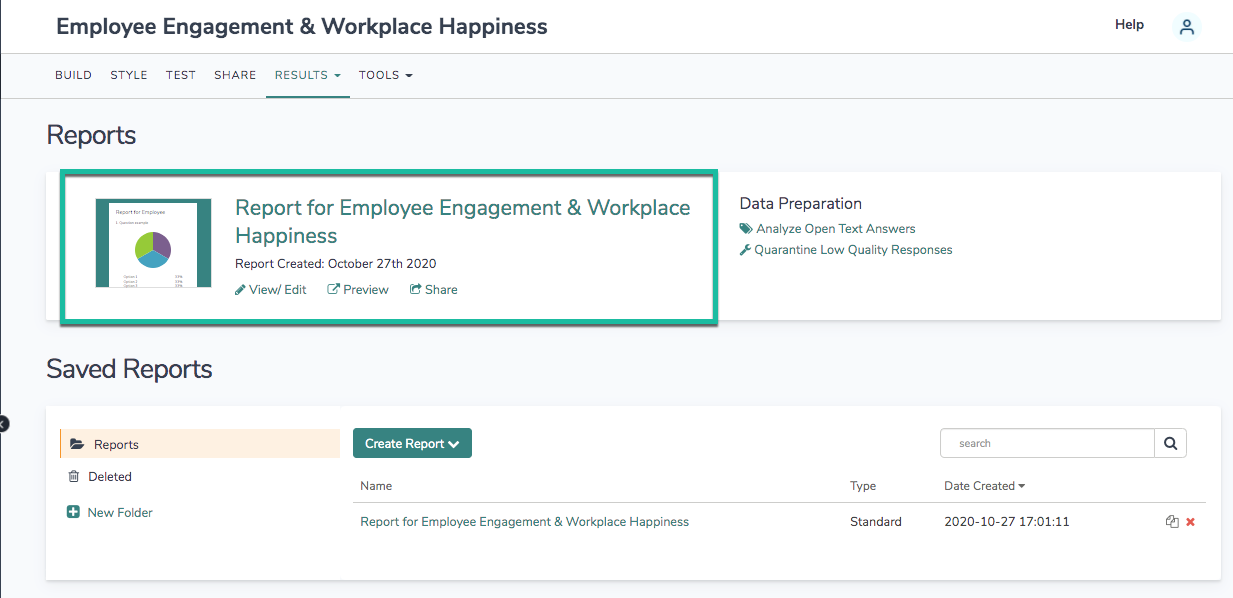
The Standard Report will be automatically created for you within your survey under Results > Reports. To get started reviewing and customizing your report click View/Edit link or the report thumbnail.
Report Customizations: Overall Vs. Individual
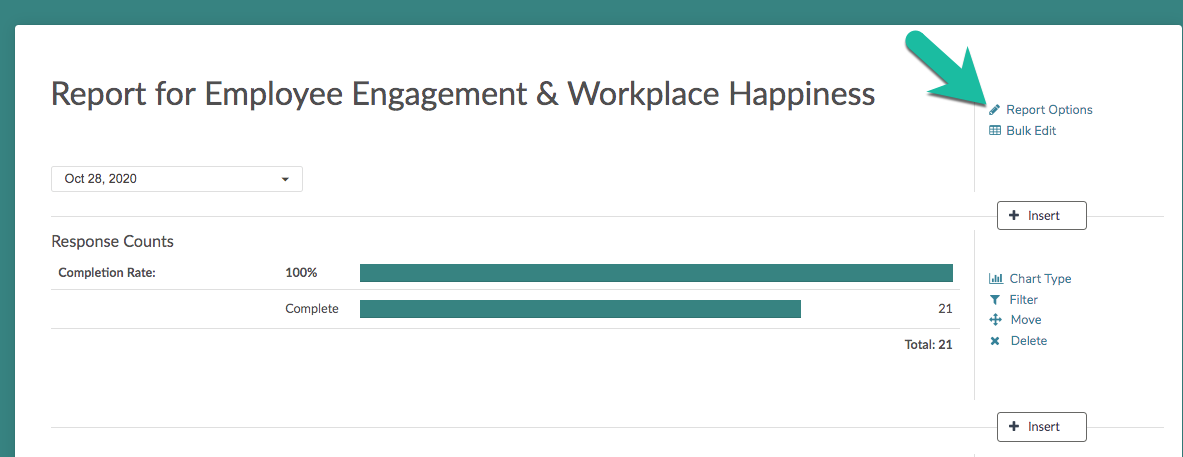
The Report Options and Bulk Edit tools allow you to make global report changes that affect all the questions in your report. Both of these options are available at the upper-right portion of your report.
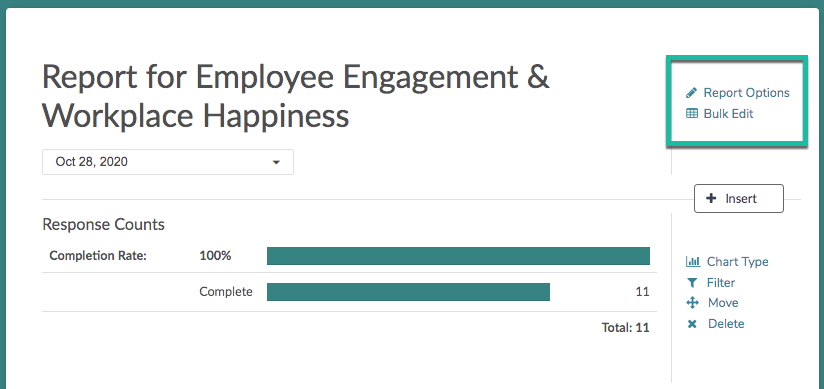
Say, for example, you want to exclude all options marked with the Not Applicable Special Setting. You can find the option to do so for all questions in your report by clicking Report Options > Answer Options.

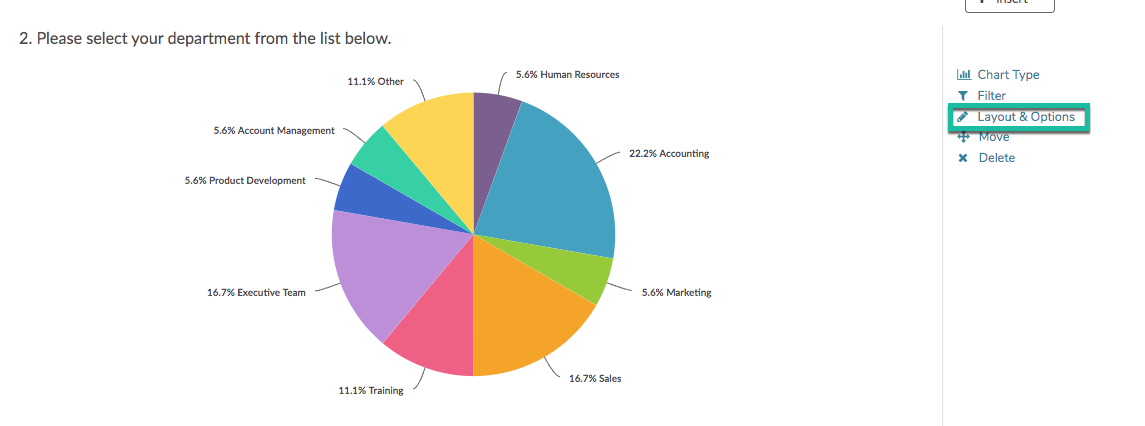
However, you can make similar changes to an individual question. To explore the customization options for each question (they vary by question type) click Layout & Options on an element in your report and select your preferences.

Use the Hover Insert Tool
We added a an Insert tool that is available between any two elements in your report to easily add new elements to the report. You can use this to add a Question, Text, Summary Elements, and Tables.
Add a Question to Your Report Using the Insert Tool
The insert tool is the easiest way to add questions to your report.
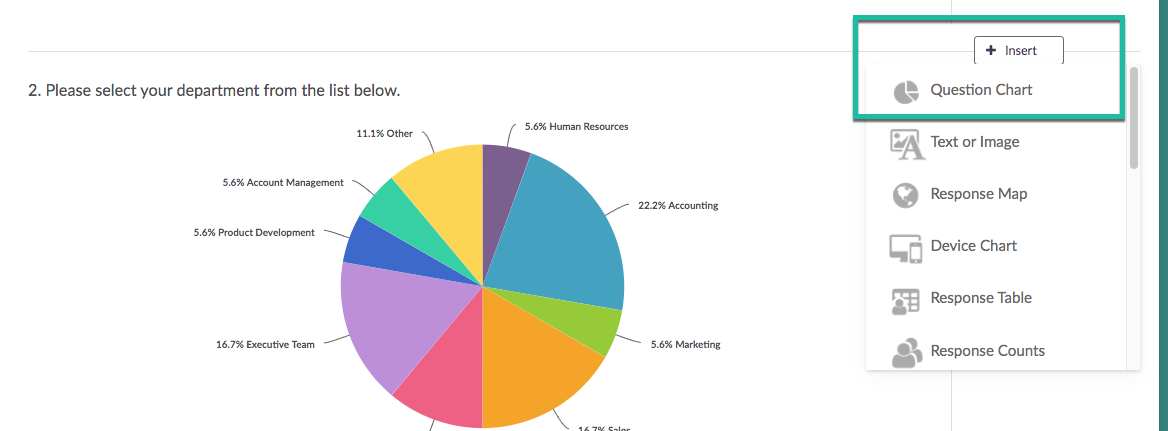
- Click the Insert button between any two elements in your report and select Question Chart from the menu.
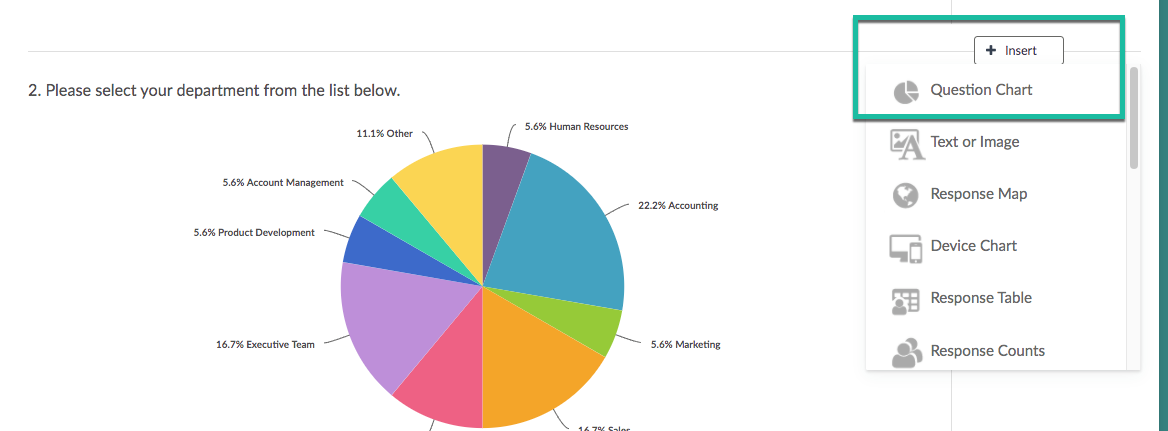
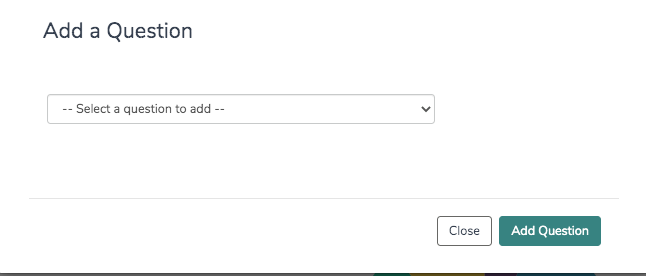
- Next, select the question you wish to add from the dropdown menu and click Add Question.
Add Text to Your Report Using the Insert Tool
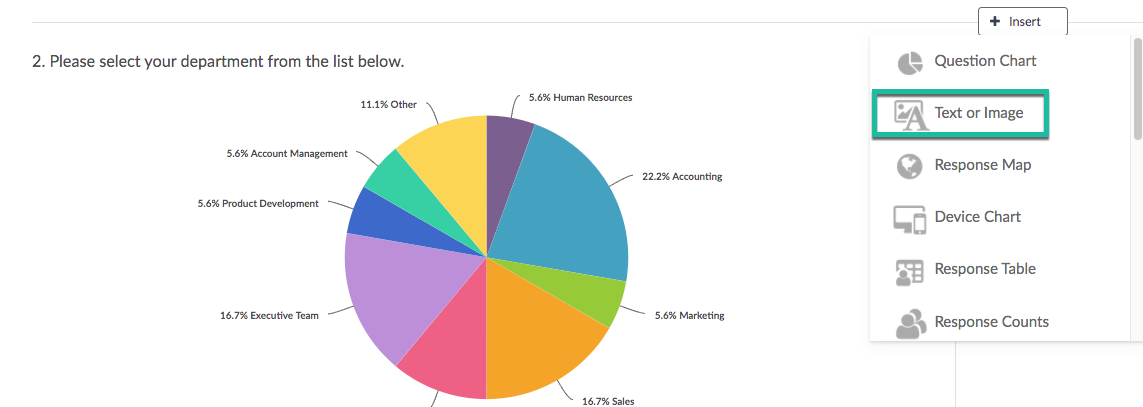
If you wish to add some text to your report, click the Insert button between any two elements in your report and select Text or Image from the menu.
Add Other Elements to Your Report: Response Map, Device Chart, Response Table, Response Counts, Response Timeline, Email Statistics, DIY Grid/Cards, Quotes, Email Invite/Contact Fields, and Crosstab
There are several other elements available to add to your report via the Insert tool. To add one of these elements click the Insert button between any two elements where you wish to add and select it from the menu.
Use the Bulk Editor
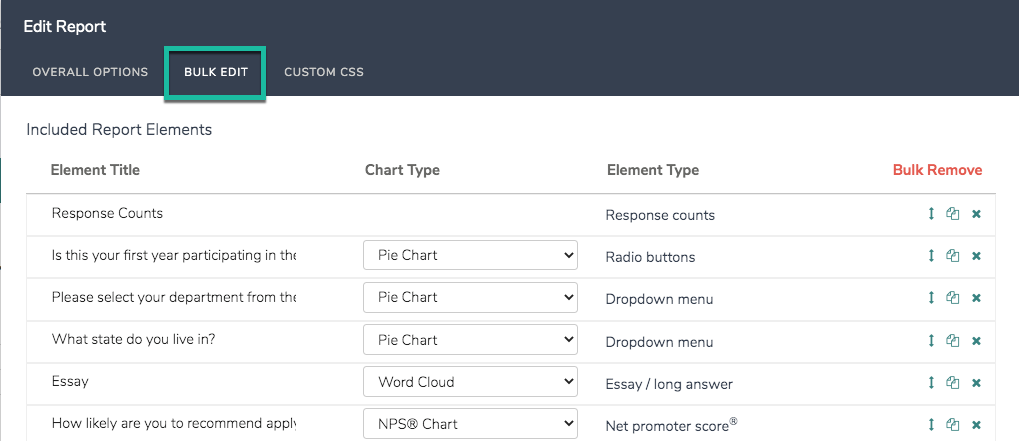
Click the Bulk Edit option in the upper-right of your report to customize the elements that are included in your report.

Via Bulk Edit, you can add, remove, bulk remove, copy and reorder questions. You can also change the chart type for compatible elements!
It's worth noting that many of these options are available when reviewing the report itself.
Filter Your Report
Filtering a Standard Report is easy as pie. You can filter by:
- Question Answers
- Response Status (Complete, Partial, Disqualified, Test)
- Response IDs
- Survey Link
- You can also create advanced filters with multiple conditions and/or groups of conditions. Learn more in our Filter Report Data Tutorial.
Access the above filtering options by clicking the Filter menu in the left-hand panel of your report. This will expose the Add Filter button where you can select one or more of the above filtering categories.

Finally, if you wish to filter by the date responses were recorded check out our Filter by Date Tutorial.
Compare Data Within Your Report
Under the Compare Segments option in the left-hand panel you can set up Segments in the Standard Report to compare subgroups within your data. Typically, segments are groups within your data that you would like to make comparisons across. For instance, you might compare responses for males and females, age groups, or other demographic or firmographic characteristics.
Segments can be set up using:
- Question Answers
- Response Status
- Response IDs
- Response Date
- Survey Links
- You can also create advanced segments with multiple conditions and/or groups of conditions.
To learn more about setting up segments check out our Segment Your Report Data Tutorial.
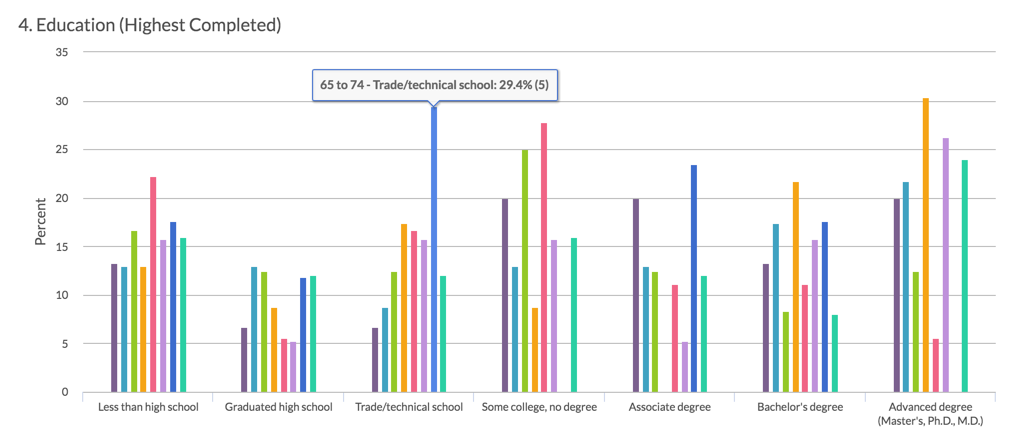
Include Individual Responses in the Standard Report
Sometimes the individual responses are as important to understanding your data as the summarized/aggregated data. Use the Insert button located between any two report elements to include a grid of your Individual Responses. Select Response Table from the available options.
After selecting this option a table of Individual Responses will be added to your report. Here you will see a list of your responses.
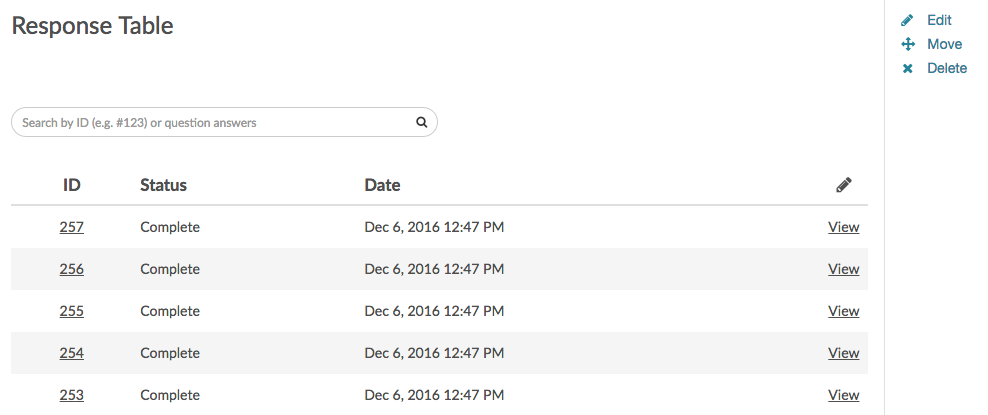
Customize Grid Columns
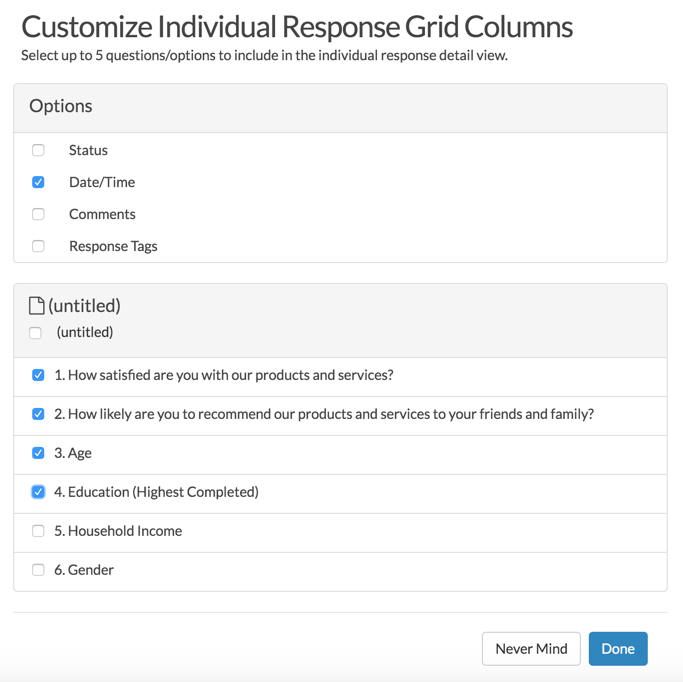
If you wish to customize what is displayed in the grid:
- Click the pencil icon in the upper right of the Response Table.
- Next, click Customize Grid Columns and select up to 5 fields to include. Be sure to scroll to the bottom of the window and click Done to apply your changes.
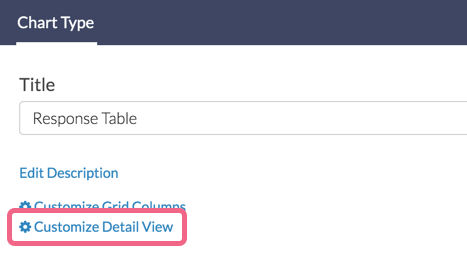
Customize Detail View
The Detail View refers to the data that is seen if a specific individual response is clicked.
- If you wish to customize the data within this view, click Edit to the right of the Table and select Customize Detail View. All pages and questions will be selected by default.
- Uncheck any questions or pages you wish to exclude from view in the Individual Response. Click Done.
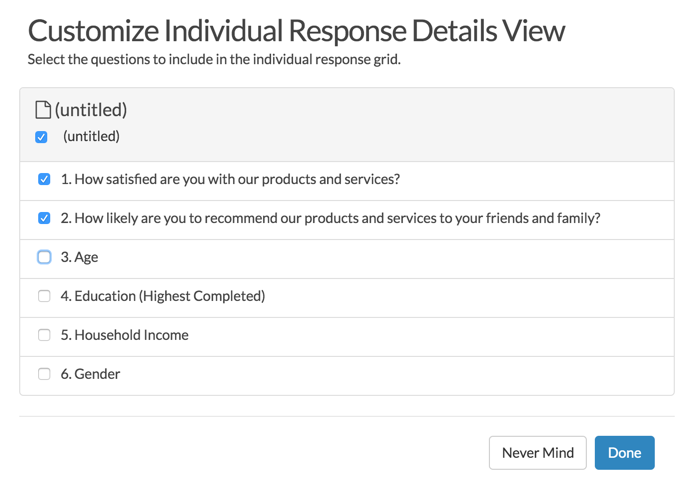
- Click Save to return to your Standard Report.
Report Options
In the Report Options menu found in the upper right of your report you will have a number of different display options, too many to cover here but we'll highlight a few.
Filter Details
By default, any time you apply filters, both overall filters and individual element filters, to your Standard Report the details of these filter conditions will be displayed in your report.
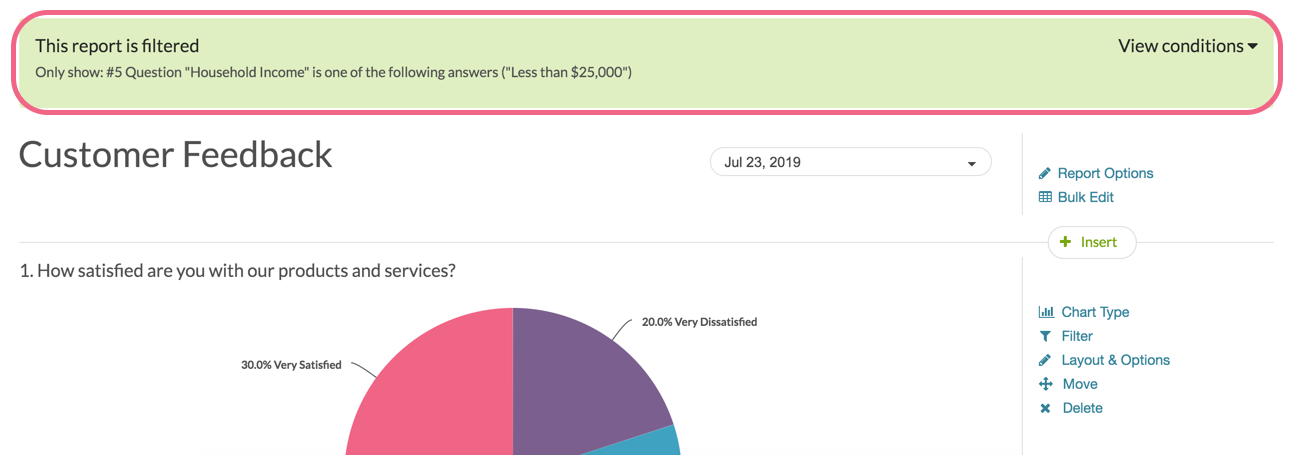
If you prefer to turn the filter details off for the entire report go to Report Options > Layout and uncheck Filter Details from the Show the Following section.

Question Numbering
Under Report Options > Layout > Question Numbering you can choose from the below options for numbering reporting elements:
- No Numbers
- Original Question Number From Survey
- 1, 2, 3, ...
- A, B, C, ...
Report Language
Have you added Translations to your survey? Change your Standard Report language by heading to Report Options > Language and selecting an available language from the Report Language menu.
FAQ
How Do I Add/Remove Questions?
The insert tool is the easiest way to add questions to your report. Click the Insert button between any two elements in your report and select Question Chart from the menu. Then select the question you wish to add from the dropdown menu and click Add Question.
You can also click Bulk Edit in the upper right of the report.
- Select the Question Chart from the Add another report element dropdown menu.
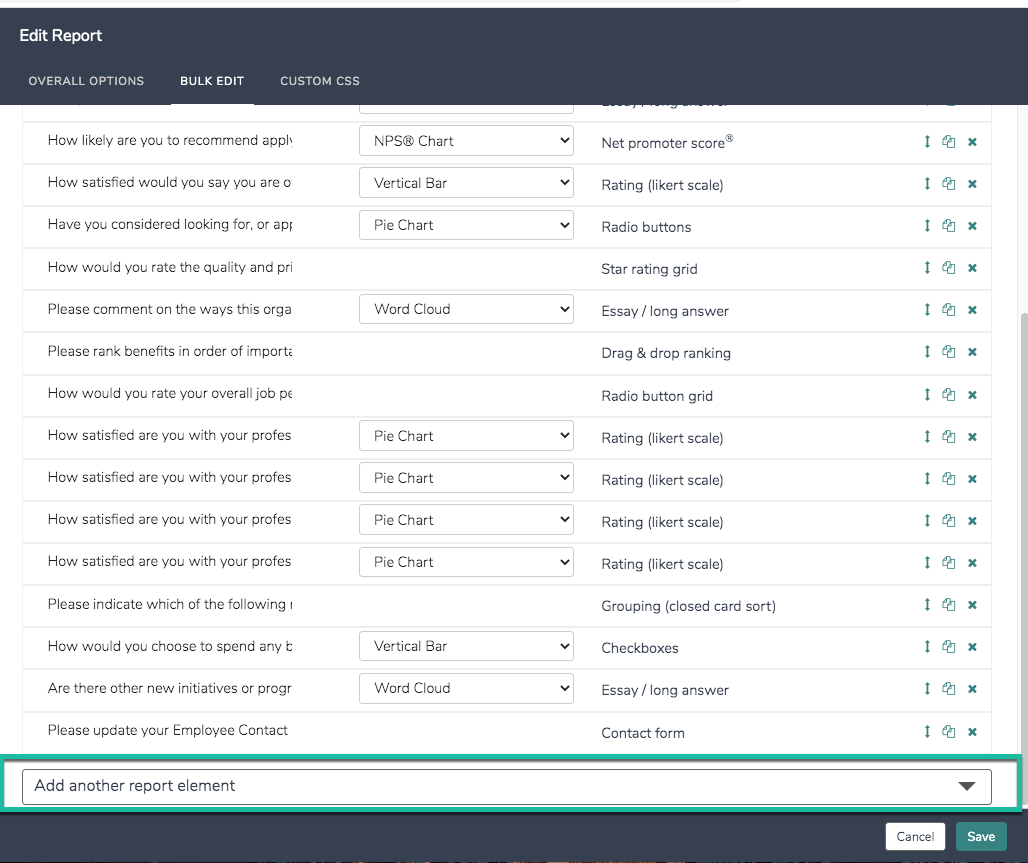
- Then select the question you wish to add from the dropdown menu and click Add to Report. When you are finished adding questions click Done.

If you wish to add all the questions in your survey select the Add All Questions option at the very bottom of the question dropdown menu.
Remove Questions via Bulk Edit
To remove questions, use the Delete option found to the right of any element. If you wish to remove questions in bulk click the Bulk Remove link to select multiple questions. Last, click Remove Selected to finish.

How Do I Report on Table Rows Separately?
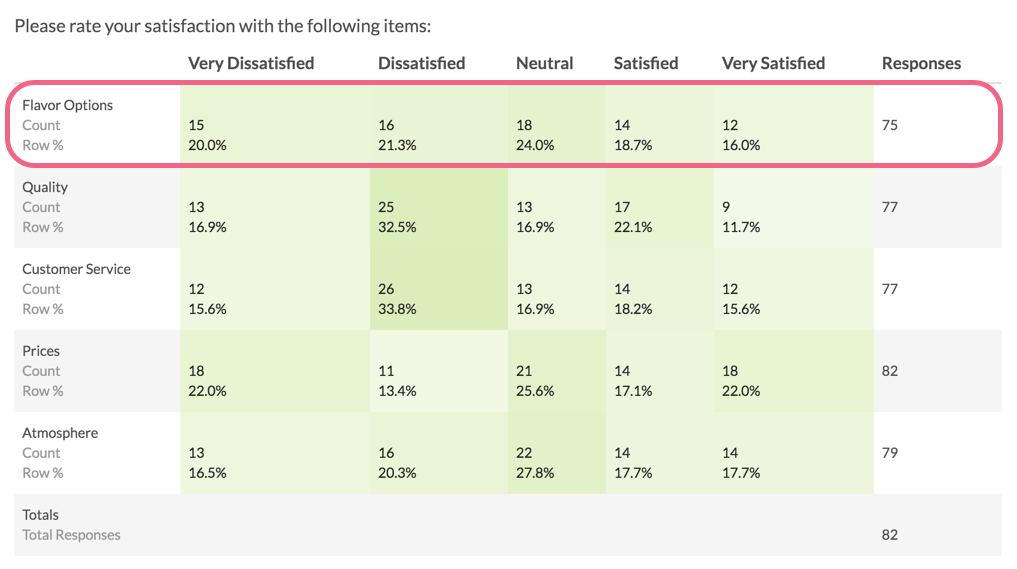
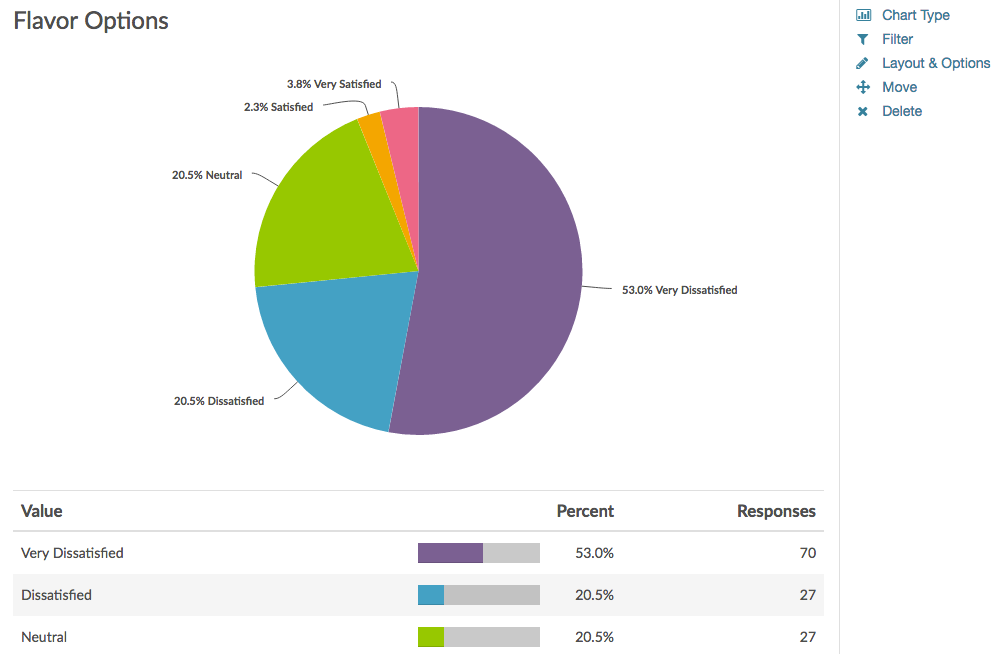
The rows of both Radio Button Grid and Checkbox Grid questions can be reported on separately as either a pie chart or a bar chart. Here are the steps to set this up:
- Click the Insert button between any two report elements and select Question Chart from the dropdown menu.
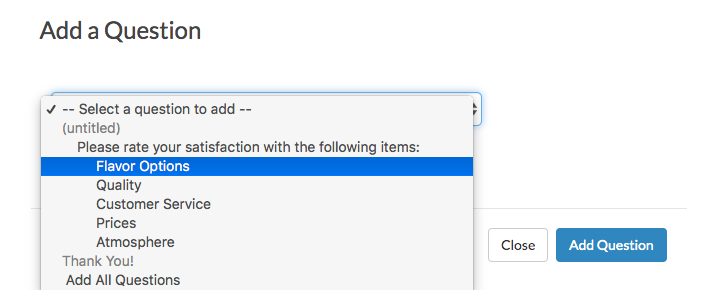
- In the next dropdown menu look for your grid question. Instead of selecting the overall question title select the first row of the grid, seen below, and click Add Question.
- Continue adding each row of the grid question. This will display the rows of the table in chart format.
How Do I Remove N/A Answer Options?
Well-designed survey questions often allow customers an opt-out option via a "not applicable" answer (or something similar) to maintain the question's validity. If you are using this option, you will likely also want to remove this option from your reports.
- To remove NA options for all questions in your report click Report Options > Layout and uncheck N/A Options under Show the Following.
- Click Save to apply the setting. For all questions with answer options set to N/A this will remove them from the chart, table and total response count!
If you wish to remove your NA options on a question-by-question basis go to the question in your report and click Layout & Options to edit. Scroll to the Answer Options, uncheck N/A Options and click Save.
Haven't set up any NA options yet? You can do so by following the steps below!
- Edit the question with the NA option.
- Edit the NA option (it can be called whatever you wish NA, N/A, Not Applicable, Does not apply, etc.) by clicking the pencil icon.
- Select Not applicable in the Special Settings dropdown menu.
- Click Done and Save.
How Do I Customize Statistics?
If you wish to include various statistics in your report go to Report Options > Layout and check the Statistics Table option.
If you wish to customize the statistics shown on a question-by-question basis go to the question in your report and click the Layout & Options to edit. Within Question Options select the statistics options you wish to include or exclude and click Save.
Please note, many of the below statistics require numeric Reporting Values.
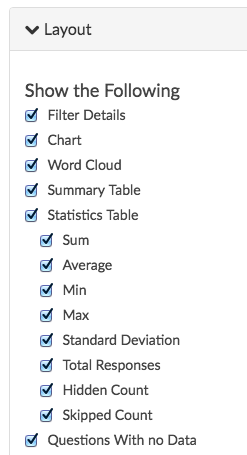
- Sum - The sum is computed by multiplying the number of responses for each option by its numeric reporting value and summing. Available for questions with numeric reporting values.
- Average - Average is the Sum divided by the Total Responses. Available for single select questions with numeric reporting values.
- Min - The minimum value selected across all responses. Available for questions with numeric reporting values.
- Max - The maximum value selected across all responses. Available for questions with numeric reporting values.
- Standard Deviation - Standard deviation is a measure of variation. Available for questions with numeric reporting values.
- Total Responses - Total responses to the question.
- Hidden Count - Total responses that did not answer the question regardless of logic that may have skipped them past the question.
- Skipped Count - Total responses who saw the question but elected to move past without answering (question must be un-required).
How Do I Download a Hard Copy of the Report: PDF or Print
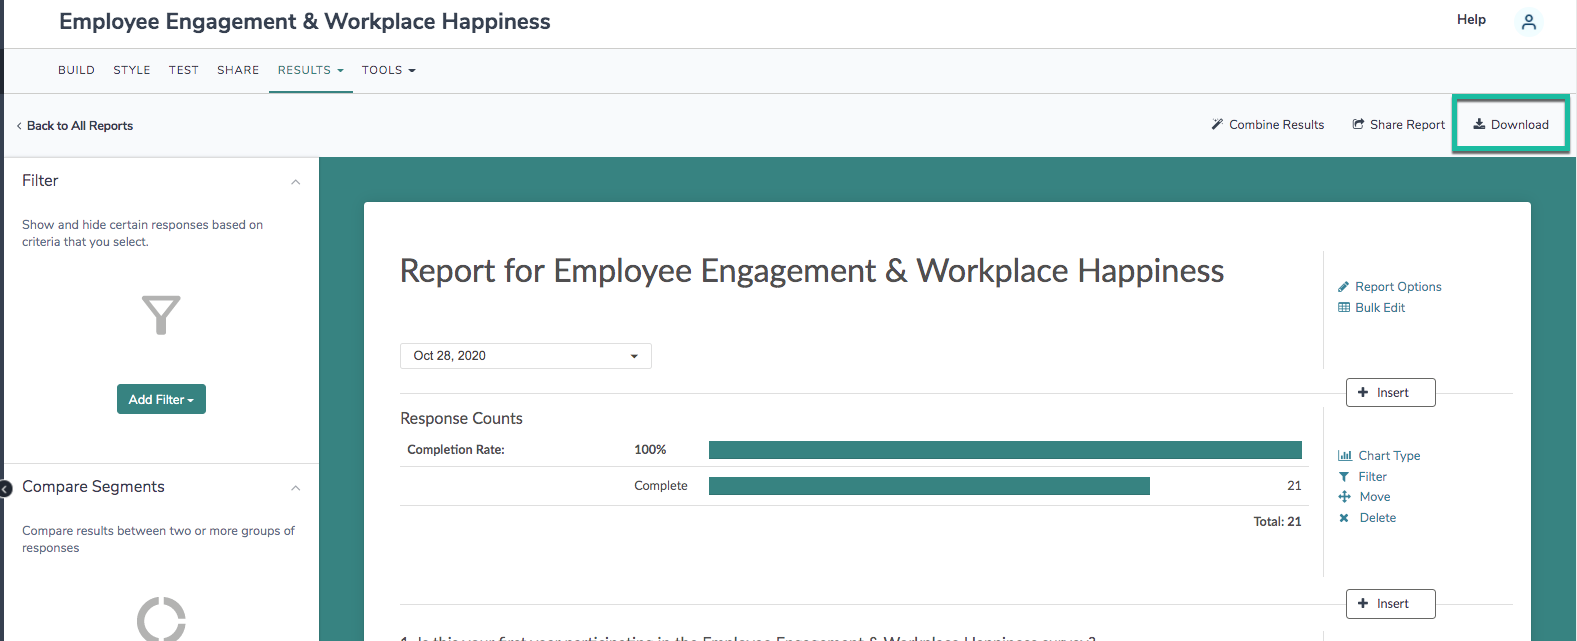
Once you are finished customizing your report, you can export the entire report either to PDF, Excel, Word, or PowerPoint. To do so click the Download button in the upper-right corner and select your desired option.
Why Did Alchemer Create This Report?
If you are a long time Alchemer user you're probably asking this question. This report includes many new features and improvements based on years of customer feedback and suggestions. We believe this a marked improvement over our previous reporting capabilities.
Here is a list of the upgrades included in this report:
- No need to "Refresh" your report; new responses will show automatically.
- Speed of running reports should be significantly improved.
- Creating filters and segments is so much easier! Learn more in our Filter Your Report Tutorial or Segment Your Report Data Tutorial.
- Filters and segments can be toggled on and off. Learn more in our Filter Your Report Tutorial or Segment Your Report Data Tutorial.
- Ability to display Filter Details as part of the report when filters are applied either to an individual element or the overall report. Show me now!
- Ability to add Individual Responses Grid to the report. Show me now!
- Shared reports have a bunch of new options including: privacy settings, date filtering, option to include individual responses. Learn more in our Share, Email and Schedule a Report Tutorial.
- Report elements can now be inserted inline. Show me now!
- Report elements can be reordered within the report itself.
- Open-text questions are included by default and can be expanded to review.
- When options are grouped into an “All Other” group, report viewers can click to drill down and see all options.
- Data from the Contact Form question type will be automatically grouped by response into Contact Cards. Check out our Contact Form Tutorial to learn more!
- Word Clouds are used for other open-text data (unless it is known to be numeric).
- Ability to add Summary elements to your report including a Response Map, a Response Timeline, a Response Counts, and a Device Chart. Show me now!
- New DIY Table for grouping data by response (this is an easy-to-use replacement for the Advanced Appendix element). Learn more in our DIY Table Tutorial.
- Ability to override many global settings per report element. Show me now!
- Styling the report is greatly improved. We've added pre-built themes and chart colors (and you can see your changes live in app). Learn more in our Style Your Report Tutorial.
- The Cascading Dropdown Menus question type is available for reporting in the Standard Report. Check out our Cascading Dropdown Menu Tutorial to learn more!
- New, more detailed reporting for Drag & Drop and Ranking Grid questions. Check out our Drag & Drop Ranking Tutorial or our Ranking Grid Tutorial to learn more!
- New Numbering Options that will update in your report. Show me now!
- PII will be automatically excluded from publicly shared reports.
Important Notes About the Data That Displays in Your Report
Old test data, that is, test data that was created prior to the release of the Standard Report (03/22/2015) will not display in your report.


