Common questions and troubleshooting tips for Alchemer's various report/export types, including:
Visit the Standard Report FAQs here.
Reports FAQs
Why do disabled questions display in my report/export?
Often questions that have been disabled have already collected data and as such may be important to your survey results. Because of this, disabled questions will show in both reports and exports by default.
Should you need to remove the results from a disabled question, you have the option to do so both in reports and exports.
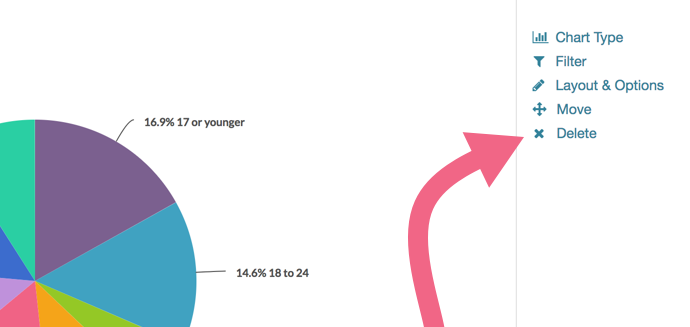
In the Standard Report, click on the Delete option associated with the element that you want to remove.
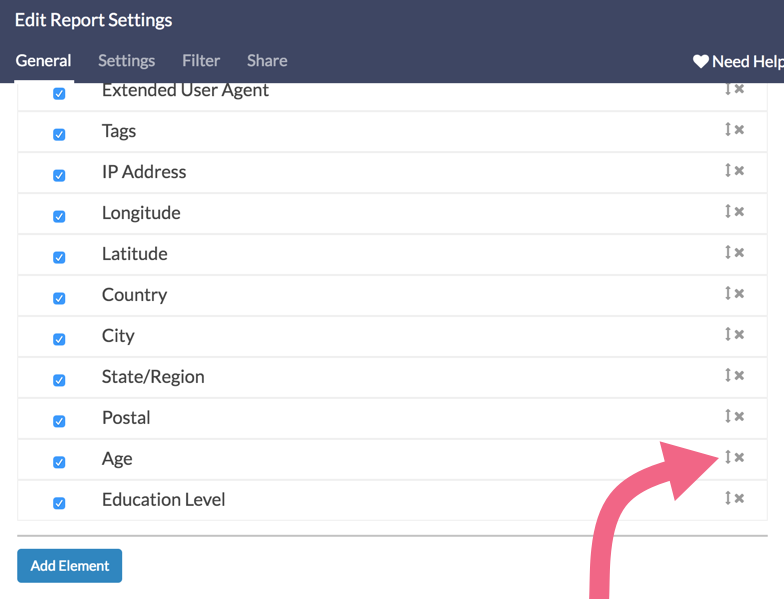
In a CSV/Excel Export, click Customize Report to access the General tab and click the x icon associated with the question that you want to remove.
How do I view results grouped by one question?
Response data can be grouped by questions through most reporting options. Each report can organize data in a slightly different way and allow for specific groups to be created and managed. Many times this is used to compare information along demographic or firmographic lines. This process varies from report type to report type.
Segments in the Standard Report
Adding segments to your Standard Report allows you to compare survey responses from different groups within a larger dataset via graphic interpretation. Segments can be set up to compare subgroups within the data.
Check out the Segmentation Tutorial to learn more about how this is configured.
Crosstab Report and Chi Square Statistic Tool
A Crosstab report allows you cross-tabulate at least two questions, one on the horizontal axis and one of the vertical axis. The data collected can be examined to identify trends and patterns through deeper analysis.
Visit the Cross Tab Report Tutorial to learn more.
Comparison Report
A Comparison Report will allow you to compare all results split by the answers to a single question. This grouping can be set up based on a single question in your survey (such as Organization, Gender, Occupation, Question 42, etc). Reporting in this way can provide a unique perspective on your data.
Check out the Comparison Report Tutorial for a more thorough explanation.
Filtered Reports
Finally, you might choose to set up a series of filtered reports based on your question of interest. For example, create one Standard Report for Males and one for Females. You can print or create share links to each of these reports to compare the data side by side.
Check out our Filter Report Data Tutorial to learn more about filtering.
No-no's that cause trouble in reporting
Below are some specific combinations of features that can cause trouble when you go to report on your data.
Using Merge Codes as a Row Header
Merge codes are really cool. Everyone that uses them has had that moment when you realize the possibilities of merge codes. Generally, merge codes are both a safe and handy tool. However, we discourage using merge codes in row headers of grid questions. While this can make for a more streamlined survey taking experience, merge codes do not populate in Alchemer reports and thus the data returned may not be sensible.
The one exception to this rule is if you plan only to use exports of your raw data, then this data can be used, albeit after a little data processing.
Changing Reporting Values in Custom Table Questions After Collecting Data
This is just a no-no. These questions are incredibly complex and changing the reporting values will significantly affect the way the data is stored and mapped.
Explore the Editing a Live Survey content to learn what can and cannot be safely updated in a live survey.
When should I use a Turf Report?
First and foremost, the Turf Report is designed to work only with two Alchemer question types:
You will not see the TURF Report as an option if your survey is not using at least one of the above compatible question types.
TURF reports can help answer burning questions such as:
- What combination of desserts should we add to our menu to reach the most customers?
- Which additional products or services can we offer to gain the most new customers?
- Which new colors should we add this upcoming season?
What is a TURF Report?
TURF stands for Total Unduplicated Reach and Frequency. It is a statistical model that estimates market potential with limited resources. It can help you choose the best configuration in order to reach the maximum people in your target audience.
For example, let's suppose that your restaurant chain recently surveyed its customers regarding their favorite desserts. However, you only have the budget to add three new desserts to the menu. A TURF report can show you which configuration of three desserts would reach and please most customers without overlap.
Learn how to create and configure a TURF Report in Alchemer.
How can I see where respondents are leaving my survey?
Are you having trouble with people leaving your survey early? Are you getting a large number of partials and you don't know why? Fear not, our Fall-Off Statistics can help!
Fall-Off Statistics are designed to analyze the survey rather than the questions in your survey, giving you the ability to identify pages of the survey where a high number of respondents have chosen to leave.
Use our Fall-Off Statistics to analyze peaks of survey abandonment and identify particular pages where you may need to change:
- elements (such as the types of questions)
- question density (number of questions on one page)
- number of pages
All of these modifications can help you avoid survey fatigue and abandonment in the future!
- To get to your Fall-Off Statistics, go to Results > Reports.
- Click the Create Report button and select Fall-Off Statistics.
What does the chart tell me?
The numbers that you are interested in are the percentage and # Left in the bar graph. If there is a large number % for that page, this means that something about that page caused respondents to fall off.
Visit the Fall-Off Statistics documentation for additional details.
When would I use a Comparison Report?
A Comparison Report allows you to view your summarized data broken down by a subgroup of the data. This grouping is set up based on a question in your survey (such as Organization, Gender, Occupation, Question 42, etc).
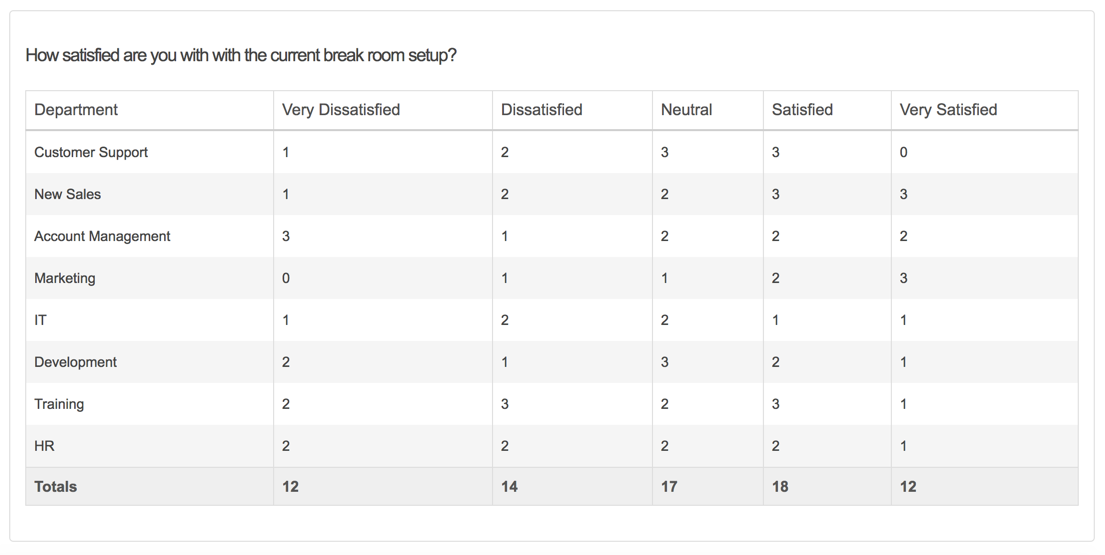
Comparison Reports are used to examine trends in your survey data across groups, typically demographic categories. If you ask in your survey for an employee's department, you might want to see how satisfied they are with the office's break room setup. So, you could choose "Department" as your source question on the report.
Note: The Comparison Report data is presented in a table format as illustrated below:
When would I use a Crosstab Report?
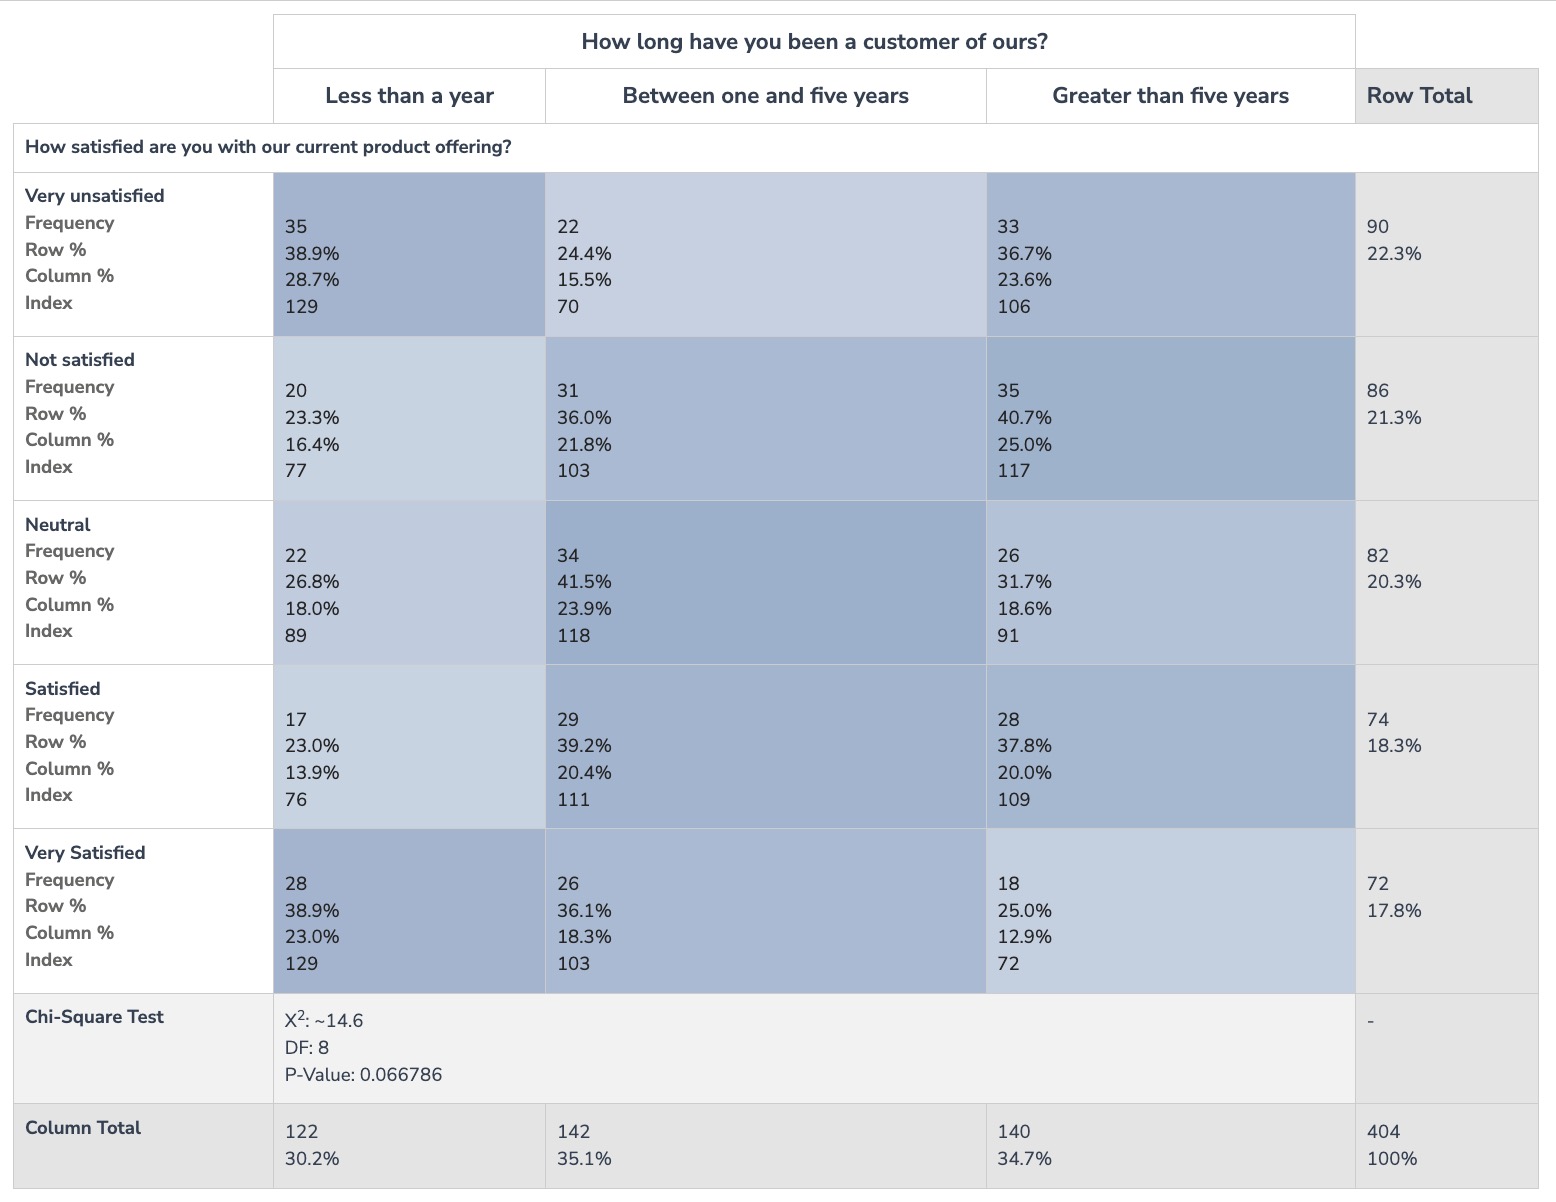
A Crosstab report (aka Contingency Table) allows you to cross tabulate at least two questions, one or more in the columns (also known as banner questions) and one or more in the rows (also known as stubs).
Use Crosstabs to examine trends and patterns that are driving your summary results. The data returned via a Crosstab report is presented in a tabular format (similar to the Comparison Report), with a number of additional statistics available:
For additional information (including setup instructions), visit the Crosstab documentation or learn about inserting a Crosstab element within a Standard Report.
Can I see how one respondent compares to the rest of the survey sample?
Creating a Profile Report allows you to compare one response against the rest of the survey sample.
For example, if you were conducting a quiz for your students, you could run a Profile Report for each response and hand out the individual report to each student. This would allow them to see how they did compared to the other students.
The Profile Report does this comparison by displaying the aggregate survey data while at the same time highlighting the specific respondent's answer, as illustrated below:

To learn more about the Profile Report (including setup instructions), visit the documentation.
Exports FAQs
What options are available for exporting my data from Alchemer?
There are a number of ways to extract your survey data from Alchemer:
- CSV/Excel Export:
This is the most commonly used export type. Data is presented in a CSV (comma separated values) spreadsheet format. - SPSS Export:
This export type not only allows you to export your data to SPSS, but will automatically setup and import your variable names, variable types, titles and value labels for SPSS as well. We do this by exporting directly to SPSS's proprietary .SAV format from Alchemer which makes the export process clean and easy. - Bulk PDF Export:
This export type allows you to export PDF documents of your survey responses, in bulk (either as one large PDF file, or as a separate PDF for each response). - Bulk File Export:
If your survey uses the File Upload question type, use the Bulk File Export to download all files uploaded by your survey respondents. All uploaded files will be downloaded as a zip file from which they can be accessed. - Piped Data Export:
The Piped Data Export is designed to export raw data from either question piped (including row piped tables) or page piped questions. Because question and page piping repeats either the question or page based on the source question, CSV/Excel Exports of the raw data from surveys with question and page piping can have an unmanageable number of columns. The Piped Data Export better handles this data by collating the questions from repeated questions and pages for each response (by response ID).
How do I share my exported data?
Your Alchemer exports* can be shared in a number of different ways:
- Share a link to your export
- Email your export
- Schedule your export to email once or on a recurring basis
*These sharing options apply to the CSV/Excel Export, Bulk File Export, and SPSS export options. The Bulk PDF Export is not currently compatible with these sharing options.
- To access your sharing options, access or create an export and click Customize Report.
- Navigate to the Share tab where you will see your various sharing options. Visit the expanded documentation for detailed setup instructions.
When would I use a Bulk File Export?
The Bulk File Export is designed to allow you to perform a bulk download of all files uploaded by your respondents via File Upload questions.
The Bulk File Export produces a .zip file that contains all uploaded content. If your survey does not contain a File Upload question, you will not see the Bulk File Export as an option.
Learn how to setup and customize the Bulk File Export.
Can I export my responses as PDFs?
While the CSV/Excel Export is a great option for exporting your raw response data, at times you may need a more reader-friendly version of your respondents' survey responses.
Using the Bulk PDF Export you can download your response data as a PDF document. There are two options for the Bulk PDF Export:
Export Via Results > Individual Responses
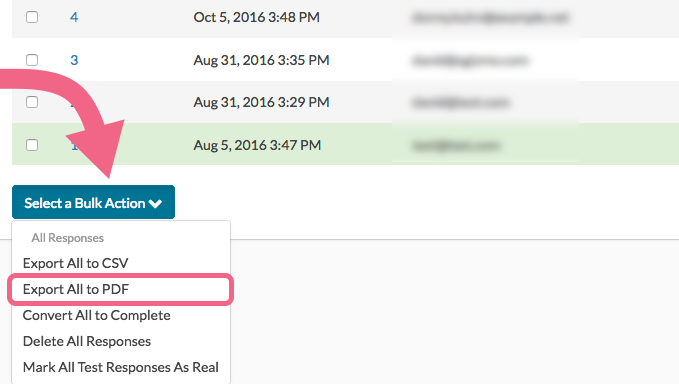
- Via Results > Individual Responses scroll to the bottom and click Select a Bulk Action.
- Click Export All to PDF. Alternatively, if you have selected some (but not all) responses, click Export Selected to PDF.
- You will be asked whether you wish to receive an email when the export is finished. Make your selection and click Start Export.
- This will create a .zip file with a PDF file for each individual response.

Export Via Results > Exports
Creating the Bulk PDF Export via Results > Exports allows you to make customizations that are otherwise not available via the Results > Individual Responses tab.
- Via Results > Exports, click the Bulk PDF link.
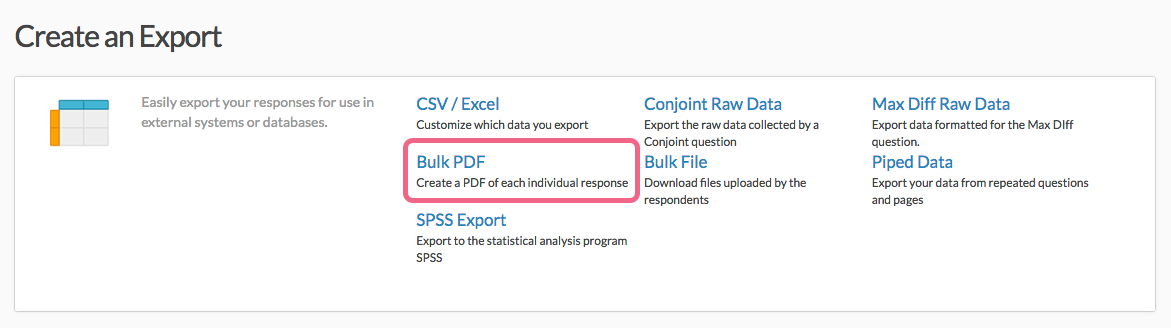
- Feel free to provide a Title for your bulk export.
- There are several settings here that can help you customize your export:
- Export on PDF - by default the Bulk PDF Export generates a separate PDF file for each responses. Check this option to instead create one large PDF containing all response data.
- Exclude Questions Hidden From the Respondents - check this option to remove questions that were not shown from the PDFs. This includes questions that were not shown due to logic.
- Change PDF orientation to landscape - the default PDF orientation is vertical - check this box to download PDFs in landscape mode instead.
- Show survey title in PDF - include the survey title on each download response PDF.
- You can also customize your data output via the Filter tab. Visit the export filtering tutorial for a refresher.
- When you are ready, click Save to run your export. A .zip file will be generated.

What is the Piped Data Export? When should I use it?
The Piped Data Export is designed to export raw data from either question piped (including row piped tables) or page piped questions.
Because question and page piping repeats either the question or page based on the source question, CSV/Excel Exports of the raw data from surveys with question and page piping can have an unmanageable number of columns.
The Piped Data Export better handles this data by collating the questions from repeated questions and pages for each response (by response ID).
For example, below is the data from a Piped Data Export. The export includes the source question and two follow-up questions that are repeated using page piping. You can see that each instance of the source question is collated for each Response ID.

Explore the expanded Piped Data Export documentation to learn about set up and limitations.
What is a CSV/Excel Export?
The CSV/Excel Export allows you to download your survey response data in a CSV (Comma Separated Values) format. This export is intended to be opened in a spreadsheet application such as Microsoft Excel or Open Office (among others).
Each unique survey response is presented as a row in the spreadsheet, with your survey questions and other data fields presented as the columns. The resulting spreadsheet looks very much like the following:

Learn about exporting your raw data (including available settings and customizations) by visiting the documentation.
Does Alchemer support exporting to an FTP site?
Yes! You can send an export of your survey's raw data to an FTP (File Transfer Protocol) site via a CSV/Excel Export.
- To set this up start by creating a CSV/Excel Export.
- Click Customize Report.
- On the Share tab scroll to the File Transfer Service Settings:
- Host/IP - Specify your FTP Host IP address.
- Username and Password - Enter your Username and Password for the FTP site.
- Remote Directory - If you wish to send this to a specific directory on your FTP site specify the path here.
- File name - Specify the file name. We recommend appending the file extension .csv so that you can open the file in Excel. You can also use use date variables as specified. Spaces are not supported in the file name.
What protocols are supported?
Only FTP and SFTP protocols are supported (not FTPS/FTPeS).
What ports are available?
Only ports 22 and 4968 are available for SFTP, only 21 for FTP.
How do I appropriately specify Host/IP file path?
The full file path must be specified, that is it must contain the root directory and all other subdirectories in which a file or folder is contained.
What Date Variables are available?
Available date variables for use in the file name include
- %d - day
- %m - month
- %Y - year
- %s - seconds
- %i - minutes
- %H - hours (24-hour format)
- %h - hours (12-hour format)
For more info check out the PHP date function documentation: http://php.net/manual/en/function.date.php
Note: You may need to whitelist Alchemer IP addresses for SFTP. Please fill out our IP Address Request Form to receive these.
Why are the characters in my CSV/Excel Export displaying incorrectly?
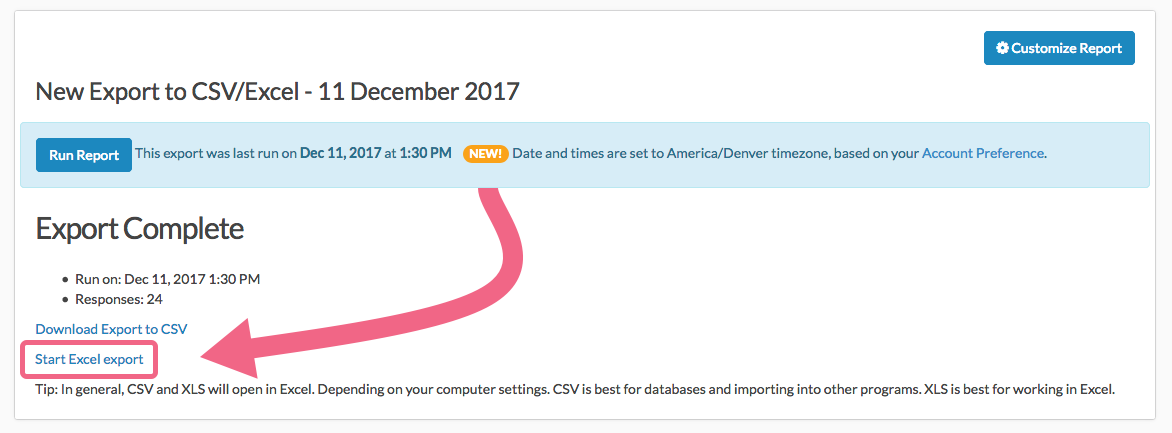
If the CSV/Excel Export of your survey's raw data has incorrectly displayed characters it's likely because your survey data is in a language that uses special characters like accents, tildes, etc. Fortunately, it's easy to fix this!
By default, the export has the .CSV or comma separated values file extension which does not support special characters. To get an export of your raw data with all of your special characters displayed correctly, click the option to Start Excel export.
Note: This option will only be available after running your initial export.
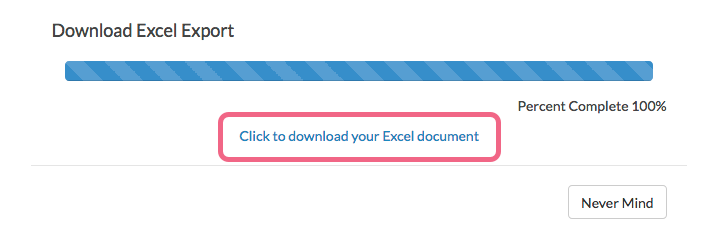
This will give you an export with the .XLSX file extension, which supports special characters.
Why am I seeing numbers in my CSV/Excel Export instead of the answer options?
CSV/Excel exports will always export reporting values rather than answer options. Often the answer option and reporting value are the same, however, these values can be customized. A common use case for reporting values is to change them to numbers in order to obtain statistics like averages and standard deviations.
While there is not an option to export answer options as raw data you can change your reporting values in order to see answer options in your raw data; learn how.
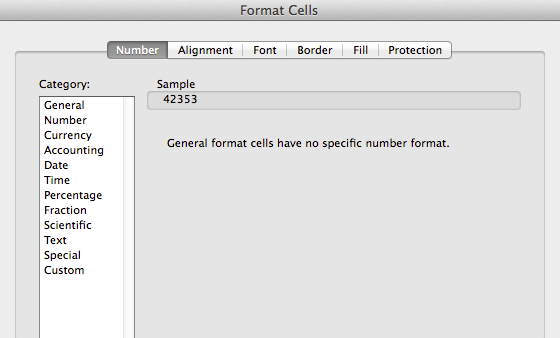
Is your exported raw data formatted incorrectly within Excel?
This can happen if you have auto-formatting turned on in Excel. This feature will try to do you a favor by recognizing data and applying an applicable format. For example, any numeric compatible with a MM-DD or MM-DD-YYYY format will show as a date. If Excel has made some assumptions that do not apply to your data you can fix this up easily!
Manually Adjusting Incorrect Formatting for a Column
Right click the column (in Excel) and select Format Cells.
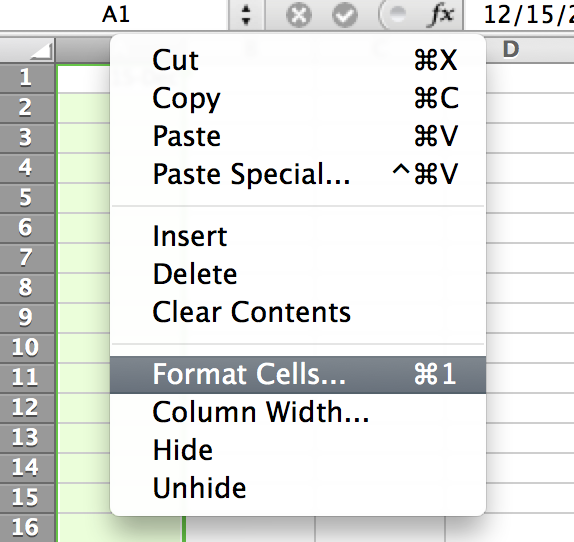
Then select the correct formatting that you wish to apply.
Turn Off the Auto-Formatting Feature
If you wish to turn off the auto-formatting feature altogether in Excel follow the below instructions and then retry opening your data:
Why is the referrer value blank?
The Http Referrer field, included on the Details tab of each response and in CSV/Excel Exports of your raw data, identifies the address of the web page that linked to the survey. Often, this field is blank. Below are some common scenarios where the referrer will be blank.
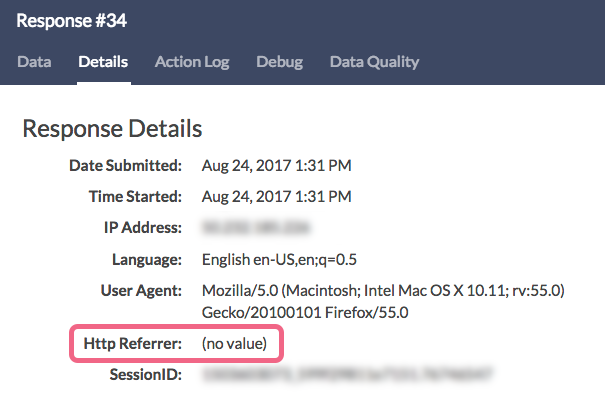
The Http Referrer value will/may be empty when the survey respondent:
- Entered the survey by clicking on a TXT Message
- Entered the survey from an email (like an email invitation)
- Keyed the survey URL directly into the browser address bar
- Entered the survey via a browser-maintained bookmark
- Entered the survey as the first page in the window/tab
- Switched from a https URL to a http URL
- Switched from a https URL to a different https URL
- Has security software installed (antivirus, firewall, etc.) which strips the referrer from all requests
- Is behind a proxy which strips the referrer from all requests
- Visited the site programmatically (ex. curl) without setting the referrer header
What's the difference between referrer and extended referrer?
Extended referrer records the same data as the referrer field however it allows for more characters in the case that your referrer is quite long.
Why are the date and time submitted showing the wrong time zone?
Have you noticed that the times and/or dates of your exported data don't seem to be correct? The Time Started and Date Submitted values that are exported as part of your survey data are based on the Time Zone setting that has been applied to your account.
- To update this Time Zone setting, click Account > Account Settings > General.
- Select the appropriate time zone via the provided dropdown menu and click Save.
This feature is only available to account administrators. If you are not an account admin, please reach out to your account admin to make this change. This will change the time zone for all users on the account.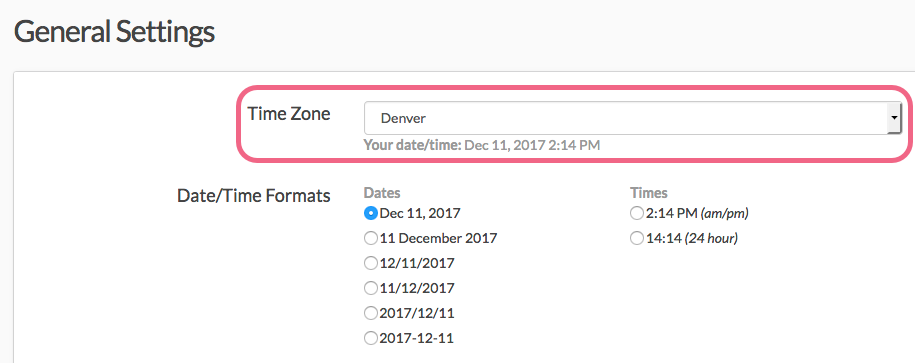

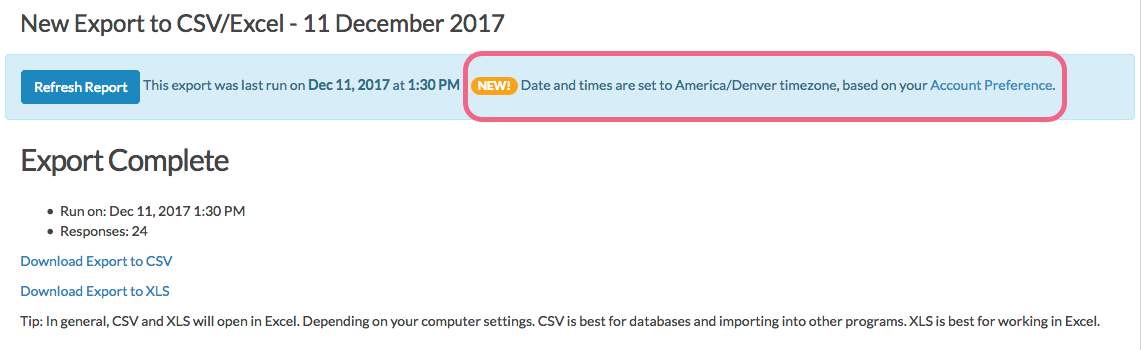
A Note About Exports
As of September 19, 2016, the Time Started and Date Submitted fields in CSV / Excel Exports will reflect the Time Zone and Date/Time Format settings of your Alchemer account. These settings can be adjusted by an Account Administrator under Account Settings > General.
Previously this information was reported in EST/EDT (GMT -5/GMT -4) regardless of your time zone settings in the application.
It is important to note that Excel will auto-convert the Sep 26, 2014 format shown above into 09/26/2016.
My checkbox question exports with one answer option per column. Can I change this to export in a single column?
This is a fairly common request and the answer is yes!
- Within your CSV/Excel Export click Customize Report > Settings.
- Scroll to the Show checkboxes as section.
- Select the Single Column option.
- Save your export settings.
Learn more by visiting the expanded documentation.
Leading zeros are being removed from my CSV/Excel Export. How do I fix this?
The easiest way to get around Excel stripping those leading zeroes is to format the cells in the spreadsheet. If you highlight the cells that are zip codes for instance, then choose Format > Cells, you can choose to format them as zip codes, and like magic those zeroes come back!
How do I open a zip file?
Our SPSS and Bulk PDF Exports both export a .zip file that contains multiple files that have been compressed into a single file. .zip files need to be opened with compression software before the files inside can be accessed. Fortunately, Windows, OS X, and Linux all come with ZIP compression built in to the operating system, or you can use third-party programs to access them.
Here is a guide with more info: http://www.wikihow.com/Open-a-.Zip-File-Without-Winzip
I'm having trouble exporting to SPSS, what might cause this?
There are several common issues that can arise when exporting to SPSS. Explore these below to see if they address your problem. Visit Alchemer's SPSS Export documentation for additional information.
I have foreign characters in my survey, and they're not showing up properly in my SPSS export - why is this happening?
Special characters will not work in the normal data file. You will need to run the Syntax file (.SPS) to decode them.
To open your file with the correct characters, you need to set your syntax to unicode and then run the included data file. Depending on your version you can do both of these things using a point and click method or manually. SPSS Version 14 and below does not support unicode.
To do so, open your syntax file (the .SPS file) and make sure at the top it says SET UNICODE=ON
Then run the syntax file using the .TXT file included in SPSS download folder. Make sure the /FILE="/Users/SGCustomerService/Downloads/SpssExport/spss.txt" is correctly pointing to the .TXT file.
Now click run to run your data. This should open your data in unicode with all the correct characters.
My zip file is empty - why?
This is likely the result of invalid characters in variable names. Variables that start with numbers, for instance. Double check your variable names for invalid characters. The following keywords are reserved and cannot be used as SPSS variable names:
ALL, AND, BY, EQ, GE, GT, LE, LT, NE, NOT, OR, TO, and WITH.
Please refer to the SPSS Documentation for further information regarding variable name limitations.
I cannot unzip my data file - why is this happening?
This is typically the result of duplicate variable names which corrupts the data file. This can also be caused by very long variable names (over 255 characters). Double check your variable names for duplicates and to ensure that they are not too lengthy (255 characters) re-run the download and you should be all set!
I have numeric reporting values defined but I am still getting option SKUs (ex. 10001) in my data file - why?
More often than not this is due to trailing blanks which are not stripped in our system so that the value is interpreted as a string value triggering the use of option SKUs.
I want to use really long reporting values, how many characters can my reporting values use?
We have found that the upper limit of reporting values for SPSS is 64 characters. Keep yours under 64 and you should be good to go!
How does piped data export to SPSS?
Piped data can be many things; it can be answers that have been drawn from answers to a previous question, it can be a single question repeated dynamically based on answers to previous questions, and it can be a page repeated multiple times based on previous answers.
Piped data differs from other data recorded in Alchemer in that the questions and answer options that store the data are not built into the survey, but are instead generated dynamically on the survey while it is being taken. This presents a major difference in how the data is stored.
Learn about how piped data is represented within your SPSS Export.
Miscellaneous Results FAQs
Can I weight data in Alchemer?
The practice of weighting data is very common in survey research. Typically weighting is a post-data collection task that allows you to adjust your results so that they better reflect what is known about a population (the group about which you wish to draw conclusions).
As an example, if your population is 50% male and 50% female and, after collecting your responses you have more responses from females than males you'll need to adjust for this difference to better draw conclusions about your population. This means you will need to either reduce the influence that male responses have on your data or increase the influence that your female responses make.
Here is an article that further explains the reason for and the process of weighting data.
At this time, Alchemer does not have an analysis tool for weighting data. For your weighting needs, we recommend using an advanced analysis tool (like SPSS) that allows you to create new variables post data collection.