Making important decisions can be difficult and time-consuming. TURF reports can help answer burning questions such as:
- What combination of desserts should we add to our menu to reach the most customers?
- Which additional products or services can we offer to gain the most new customers?
- Which new colors should we add this upcoming season?
TURF stands for Total Unduplicated Reach and Frequency. It is a statistical model that estimates market potential with limited resources. It can help you choose the best configuration in order to reach the maximum people in your target audience.
For example, let's suppose that your restaurant chain recently surveyed its customers regarding their favorite desserts. However, you only have the budget to add three new desserts to the menu. A TURF report can show you which configuration of three desserts would reach and please most customers without overlap.
Set up Your Survey
You can use either a Checkbox or Image Select (Multiple) question type as the basis generate a TURF report.
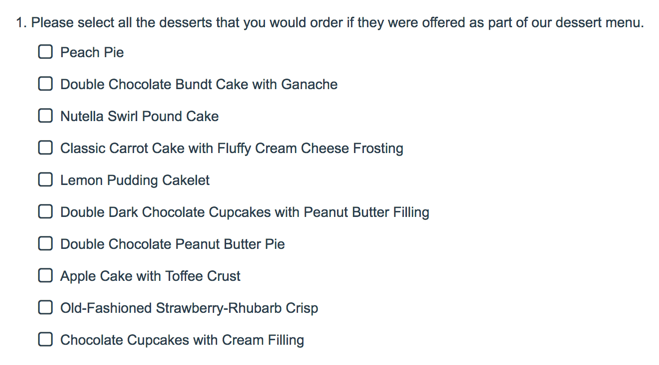
- Continuing with the above example, we're using a checkbox question to ask which desserts customers would order if we added them to our dessert menu.

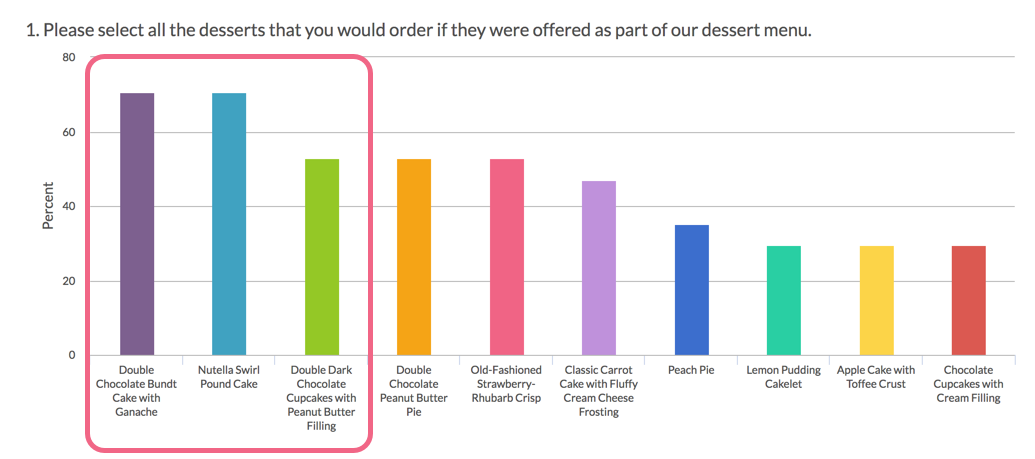
- The Standard Report shows the results of the checkbox question in bar chart format, and you can see the 3 most popular desserts by overall frequency.

Based on the Standard Report, we could offer the Bundt Cake, Nutella Pound cake, and the Chocolate Peanut Butter Cupcakes, but what if most of these responses are contributed by the same people? Perhaps people that chose the Nutella Cake also chose the Peach Pie or the Apple Cake. If so, we might risk leaving out a large number of customers and risk potential revenue. Are we really getting the most bang for our buck?
That is where the TURF report comes into play.
Create a TURF Report
We want our TURF Report to tell us which combination of 3 desserts will please the most people. The Standard Report showed us frequency, but what we really want is unduplicated frequency.
- To create a TURF Report go to Results > Reports. Under the Create Report button select TURF. Note: This will only display if you have either a checkbox or a multi-image select question in your survey.
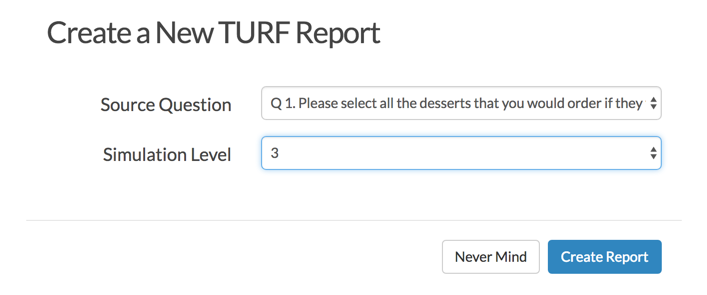
- Name the report and choose your checkbox question in the Source Question drop-down.
- Define the Simulation Level. This is the number of options you wish to compare in combination. Since we want to offer 3 new desserts, our max simulation level is 3.
 Note: The max simulation level is capped at 7, the time it would take to compute all possible combinations for higher max simulation levels would be prohibitive.
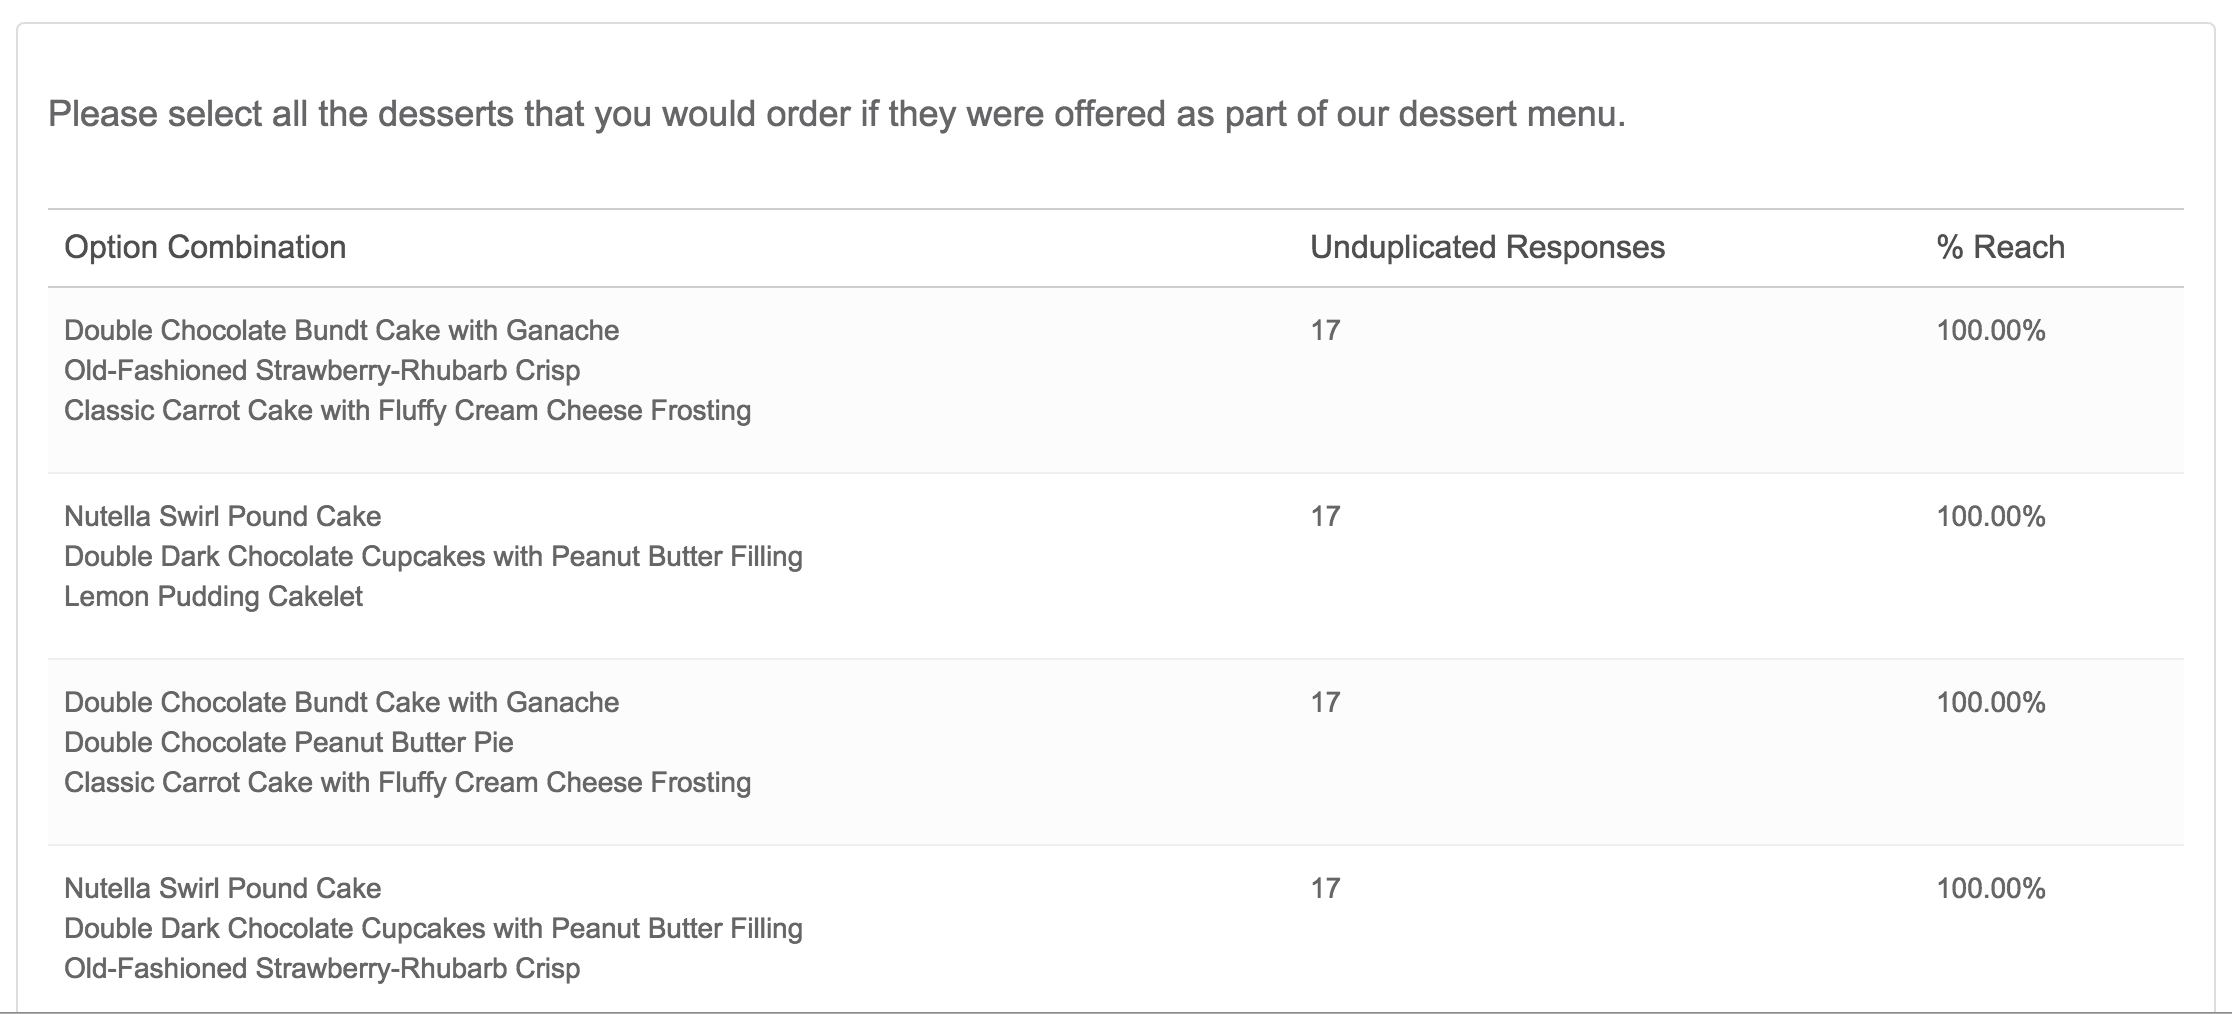
When you run the TURF report, it will determine all possible configurations of the max number of simulations, the unduplicated frequency (how many of the target audience the combination would reach), and the percent reach of the target audience (what percent of the audience the combination would please).
According to the TURF report, there are several combinations of desserts that would reach 100% of our audience, none of which are the same as the highest frequency desserts presented in the Summary Report.

Optional: Filter Your TURF Report
The above report includes all responses. If you ask a demographic question, like age, sex or educational level, you can filter the TURF Report for that specific target audience. Please note: A TURF report is not designed to be filtered by the source question.
Special Answer Options like None of the Above and N/A are included by default in a TURF report, but you can easily use a filter to exclude those answers.
- To create a filter, click Customize Report and access the Filter tab.
- Apply your filter and click Save to re-run your report. Visit the Report Filtering documentation to learn more.
Share Your TURF Report
Good data is something you rarely want to keep to yourself. Luckily, Alchemer provides you with many ways to share your reports with the people who matter.
Via the Share tab when you Customize Report, you can share your report via email (with scheduled deliveries) or create a web link or JavaScript embed that stakeholders can access.

If online reports don't quite meet your needs, you can also download your report to PDF, Word, or Excel.

Compatible Questions
- Only Checkboxes and Image Select (Multi) are available for TURF analysis
- Piped questions are not available for TURF analysis


 Note: The max simulation level is capped at 7, the time it would take to compute all possible combinations for higher max simulation levels would be prohibitive.