Piped data can be many things; it can be answers that have been drawn from answers to a previous question, it can be a single question repeated dynamically based on answers to previous questions, and it can be a page repeated multiple times based on previous answers. Piped data differs from other data recorded in Alchemer in that the questions and answer options that store the data are not built into the survey, but are instead generated dynamically on the survey while it is being taken. This presents a major difference in how the data is stored.
In this document we will discuss how the various piping features report and export so that you are aware of what you are getting into when using piping.
Simple Piping
Using simple piping, a.k.a merge codes, you can display a single answer from a previous question on a later page. This is typically used in the question title or in a text/instruction element. Check out our Simple Piping Tutorial to learn more!
Reports
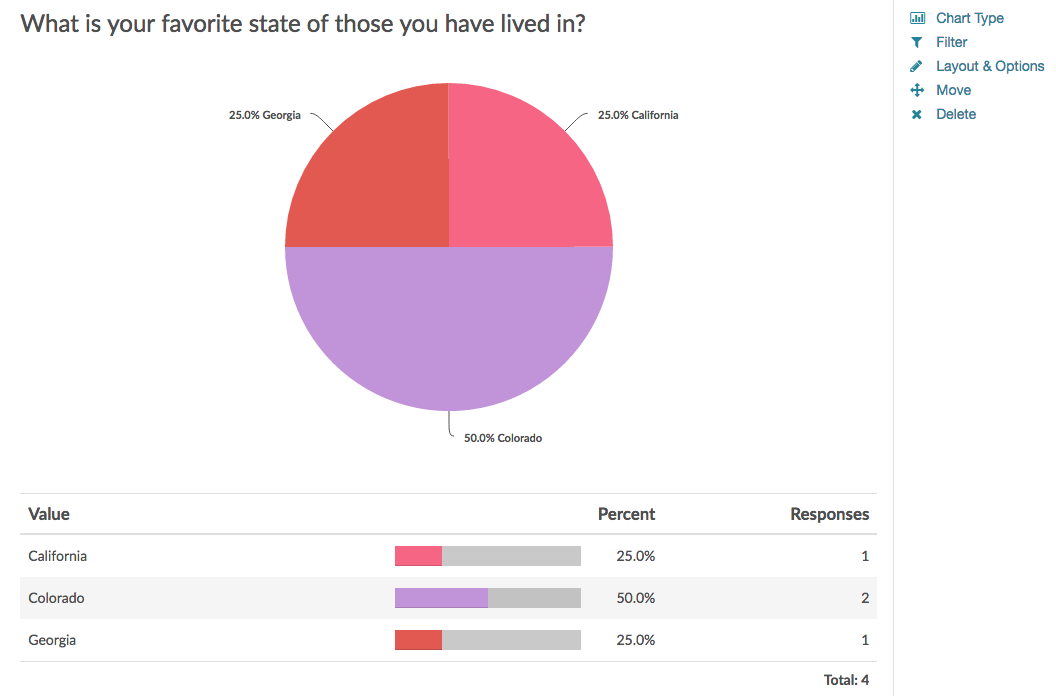
Merge codes used in question titles and/or answer options will not dynamically display in a Standard Report or Legacy Summary Report as the data is aggregated across all instances of this merge code value.
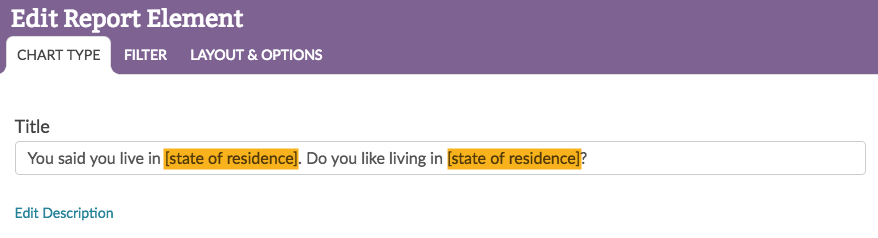
As a workaround, you can edit the element via the Chart Type option and customize the title to display something a little cleaner.
Exports
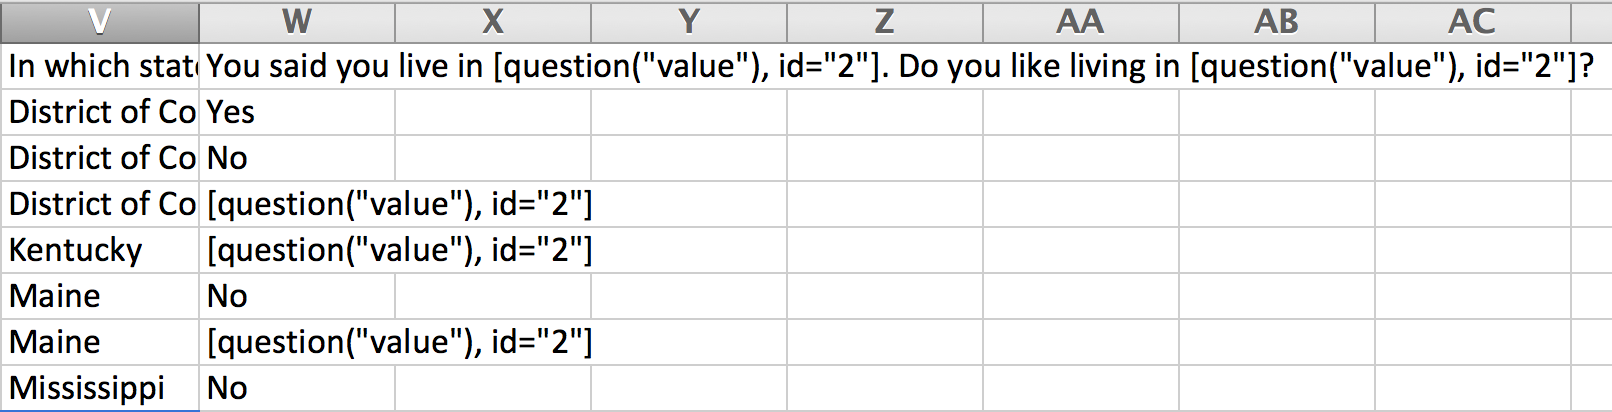
In the CSV/Excel Export of the raw data, the merge code will also be displayed in the column header, which displays the question title, and the individual cells where the merge code answer option was selected.
Option Piping
Using option piping you can use the answer(s) (either those that were selected or left unselected) from a previous question as the answer options in a question on a later page. Check out our Option Piping Tutorial to learn more!
Reports
Option piped questions report as any other question in reports and exports! One thing to note is that if a given option was not selected in the source question, it will not be listed as an option in the piped question. Can't live with this? Consider using Answer Option Logic instead of option piping!
Exports
Option piped questions report as any other question in reports and exports! One thing to note is that if a given option was not selected in the source question, it will not be listed as an option in the piped question. Can't live with this? Consider using Answer Option Logic instead of option piping!
Question Piping
Using question piping you can repeat a question on a later page using the answer(s) (either those that were selected or left unselected) from a previous question. Check out our Question Piping Tutorial to learn more!
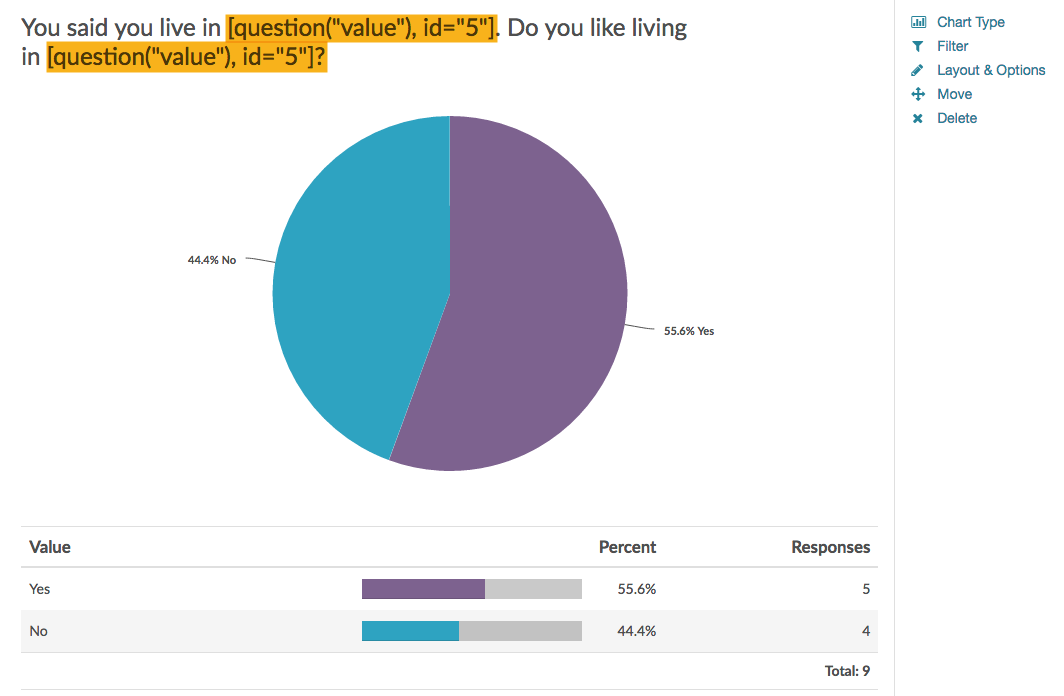
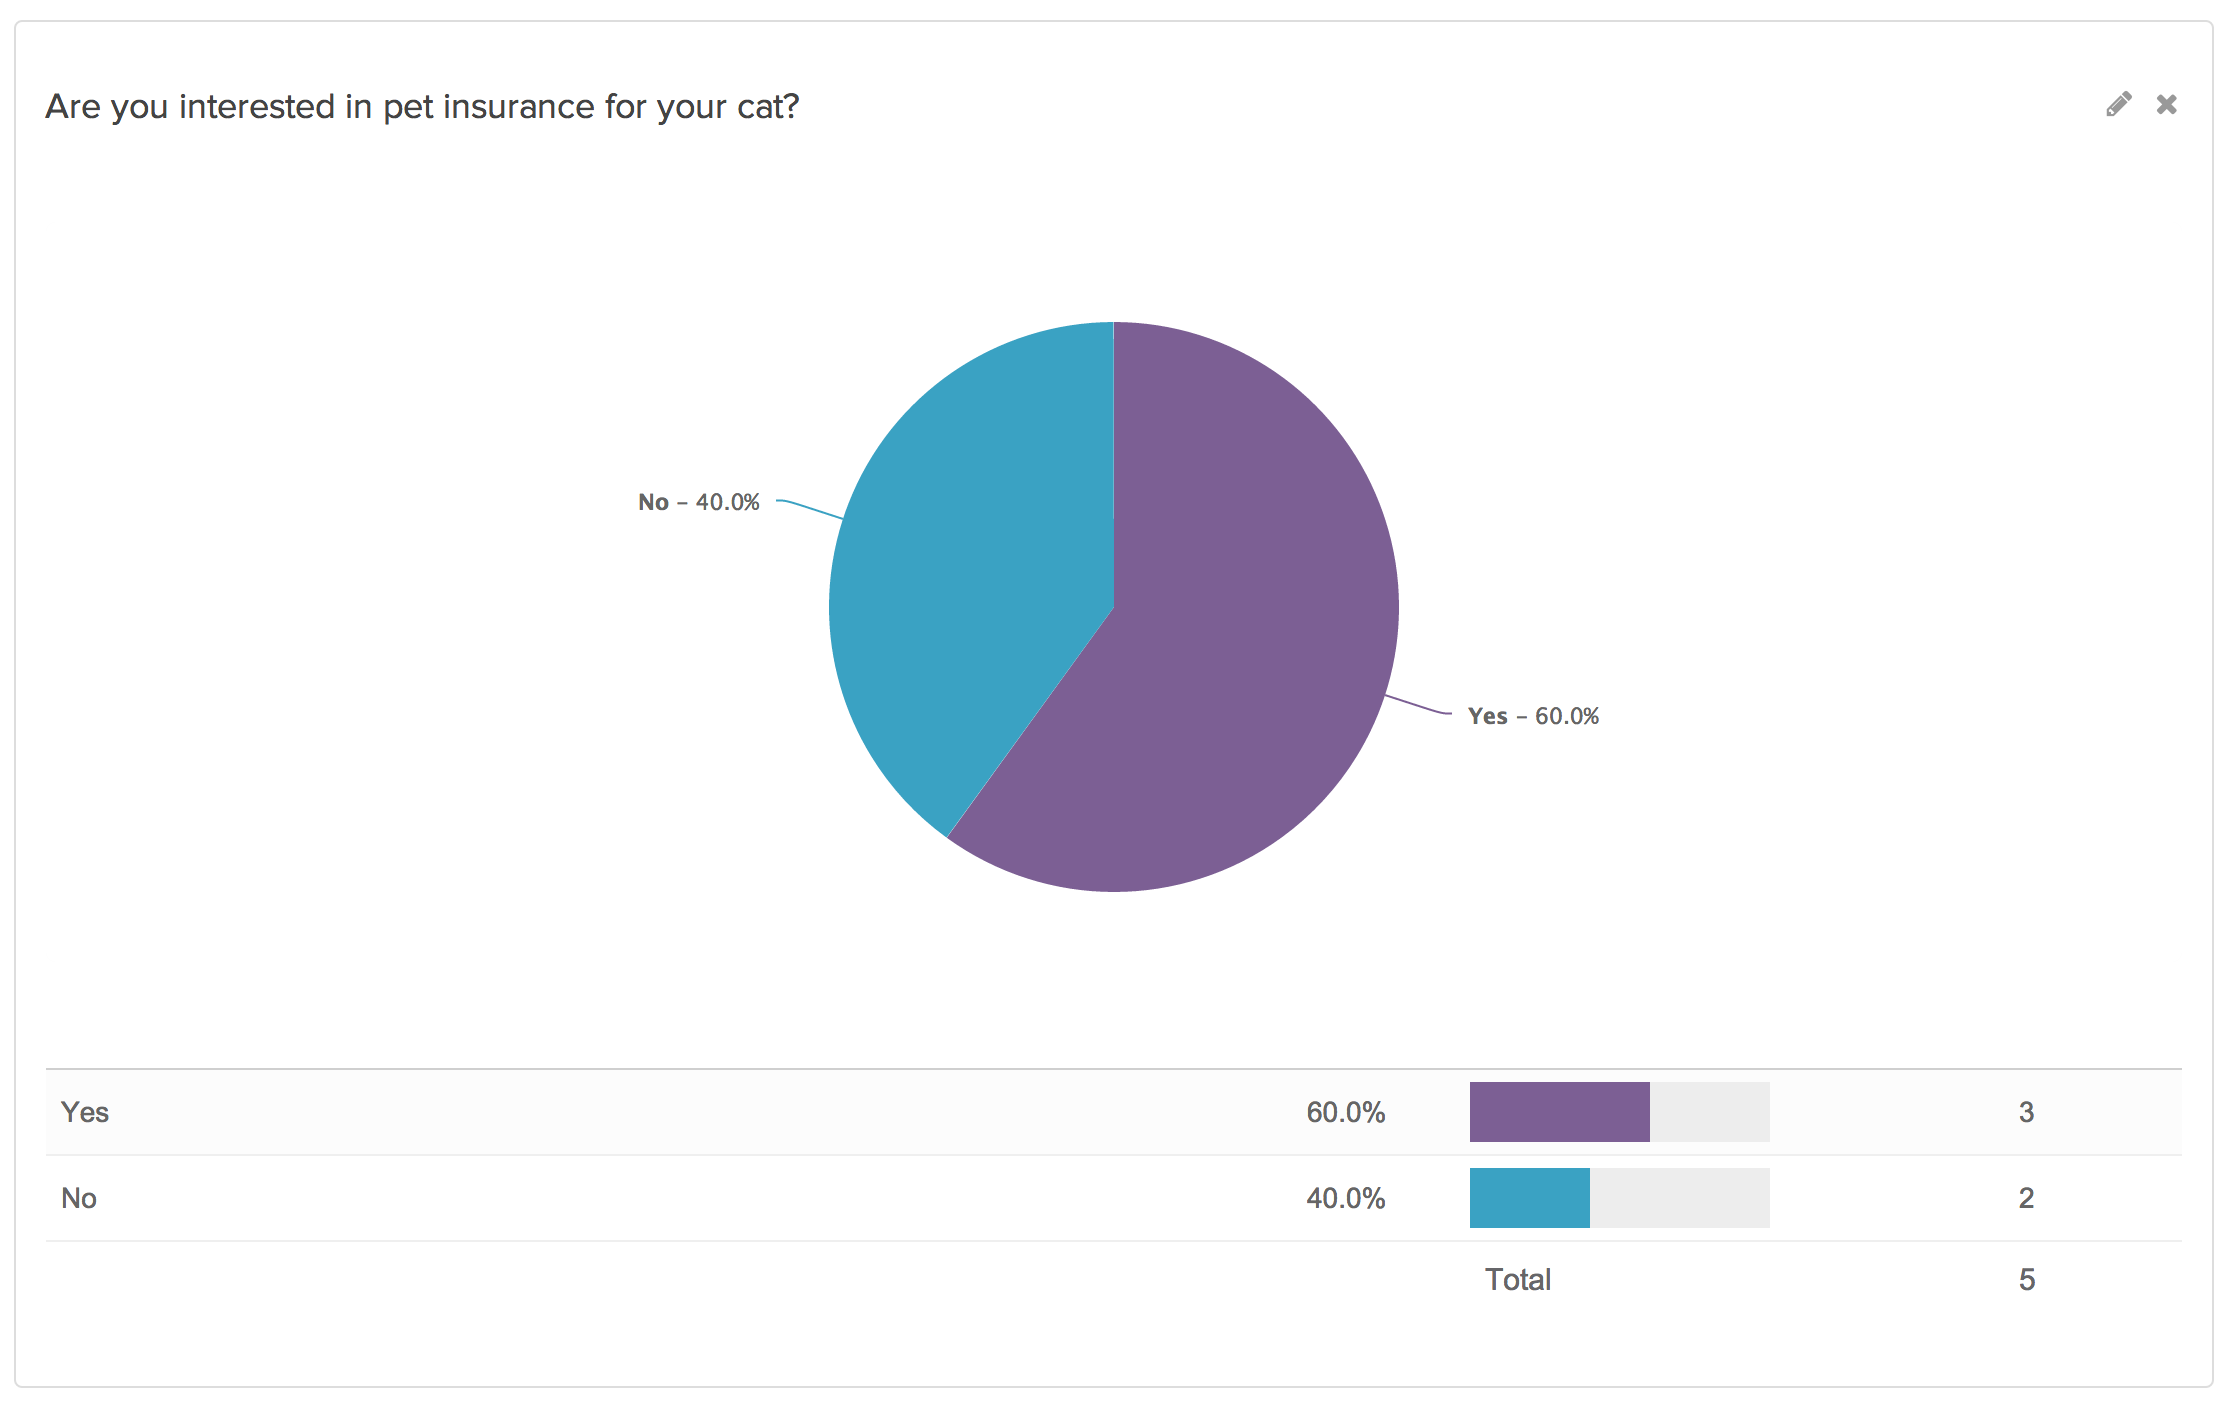
Standard Report
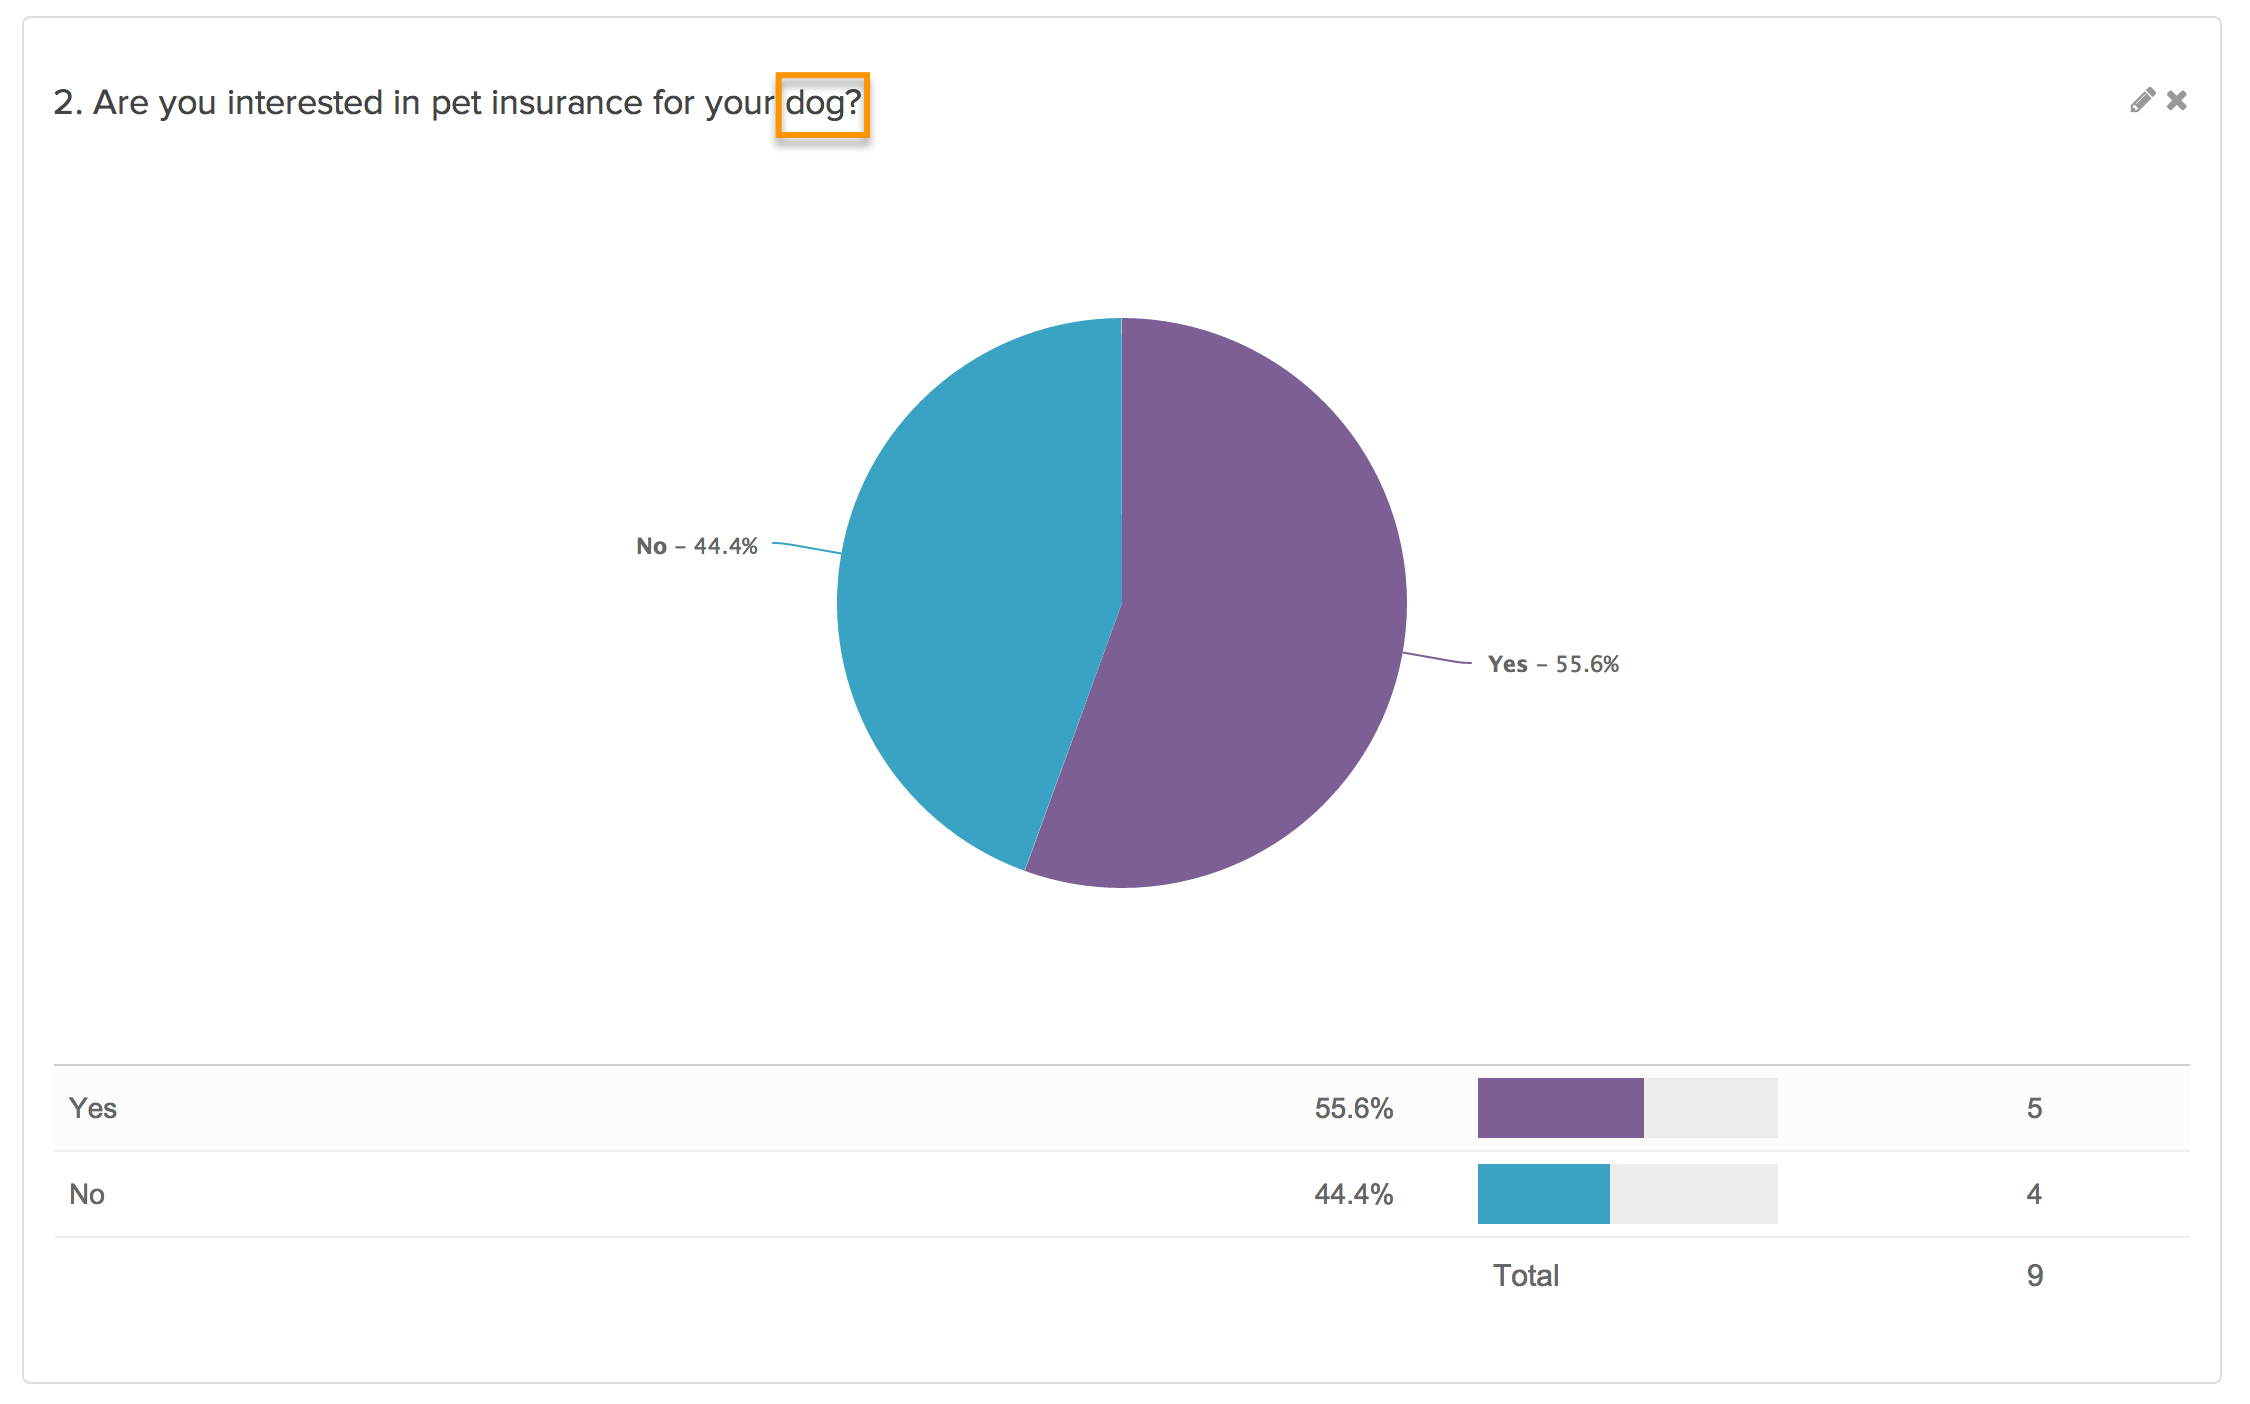
The Standard Report will automatically create segments based on the source question option so that you can make comparisons across the responses to the piped question.
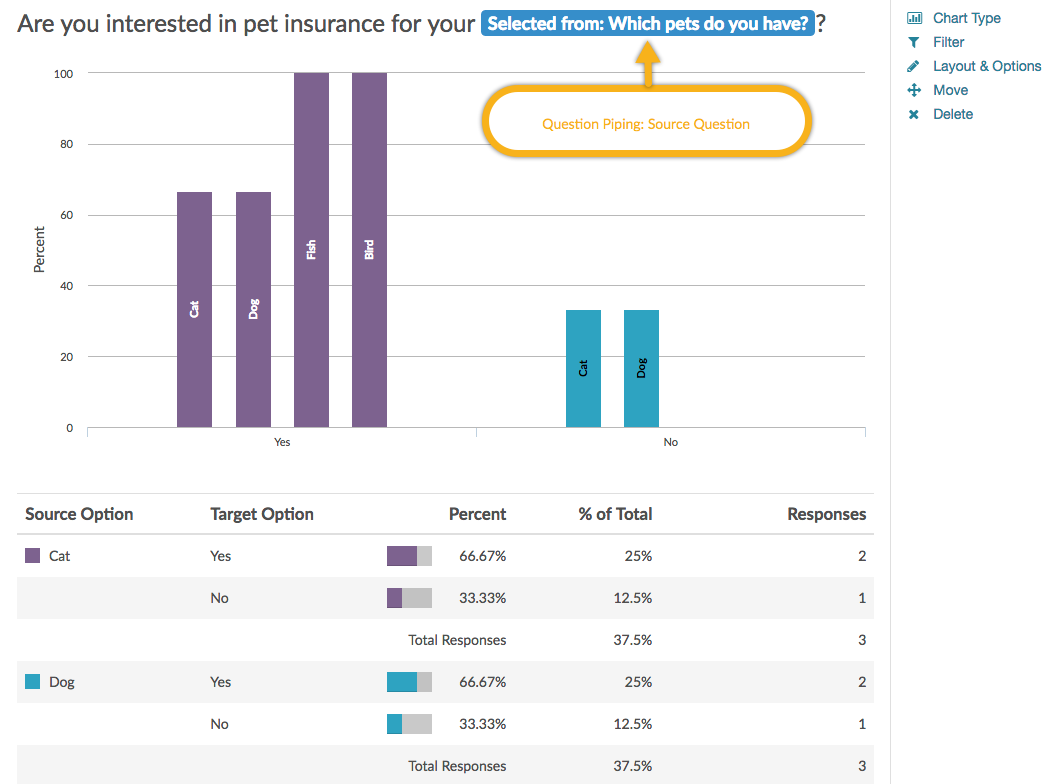
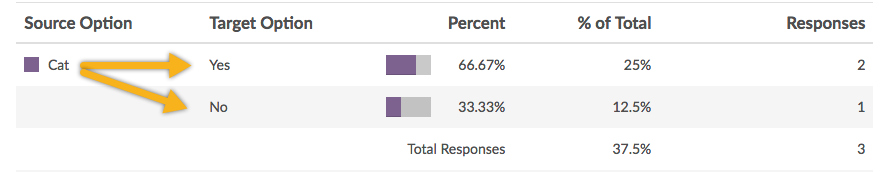
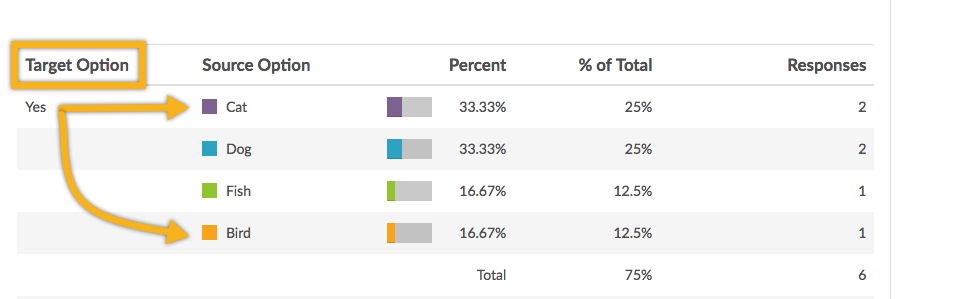
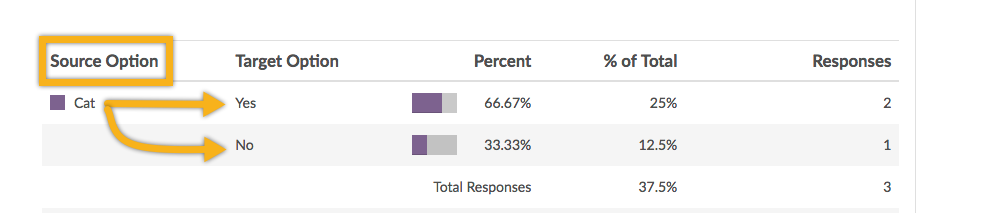
Below the segmented chart, you will find a grid providing further information. By default, the grid will be grouped by Source Option (from the source question).
Note: Be careful to consider the source question you are piping from. If there are a lot of answer options there will be a lot of data points when reporting.
If you prefer to view your data grouped by Target Option, edit the element via Layout & Options. Locate the Piped/Repeated Question Options section and select Target Option under the Group Piped/Repeated Charts by menu.
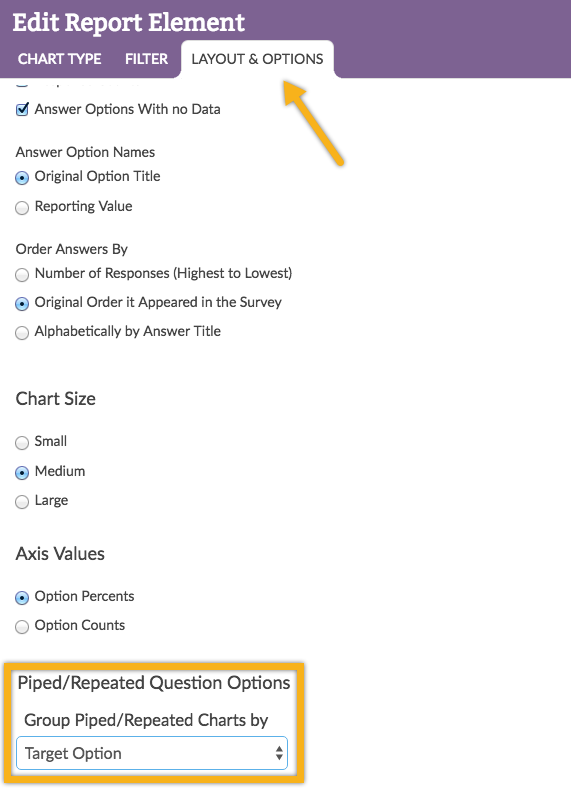
This setting can also be toggled for your entire report via Overall Options > Charts > Group Piped/Repeated Chart by. The result is as follows:
Group By Target Option
Group By Source Option (Default)
Legacy Summary Reports
In Legacy Summary Reports there will be a report element for each answer option in the source question that was piped.
Be careful to consider the source question you are piping from. If there are a lot of answer options there will be a lot of data points when reporting.
Exports
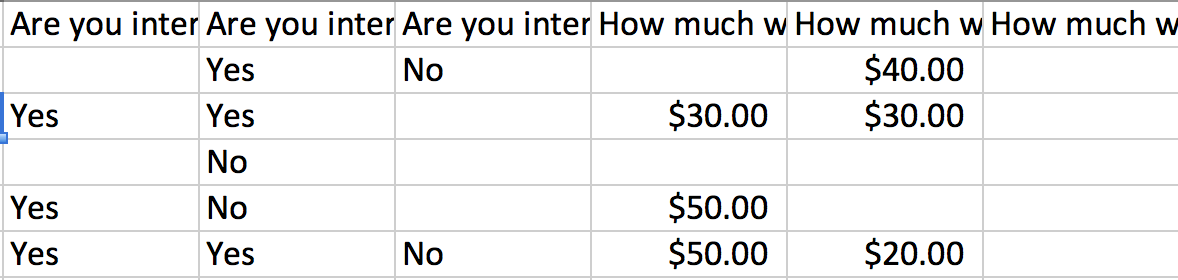
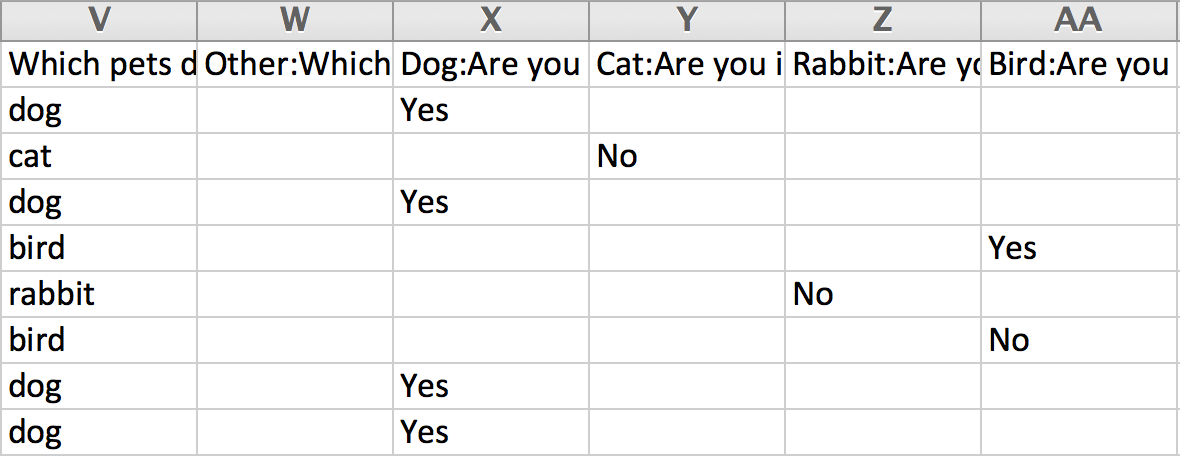
Because question piping repeats the piped question there will be a column of data for each answer option in the source question that was piped in a CSV/Excel export of your raw data.
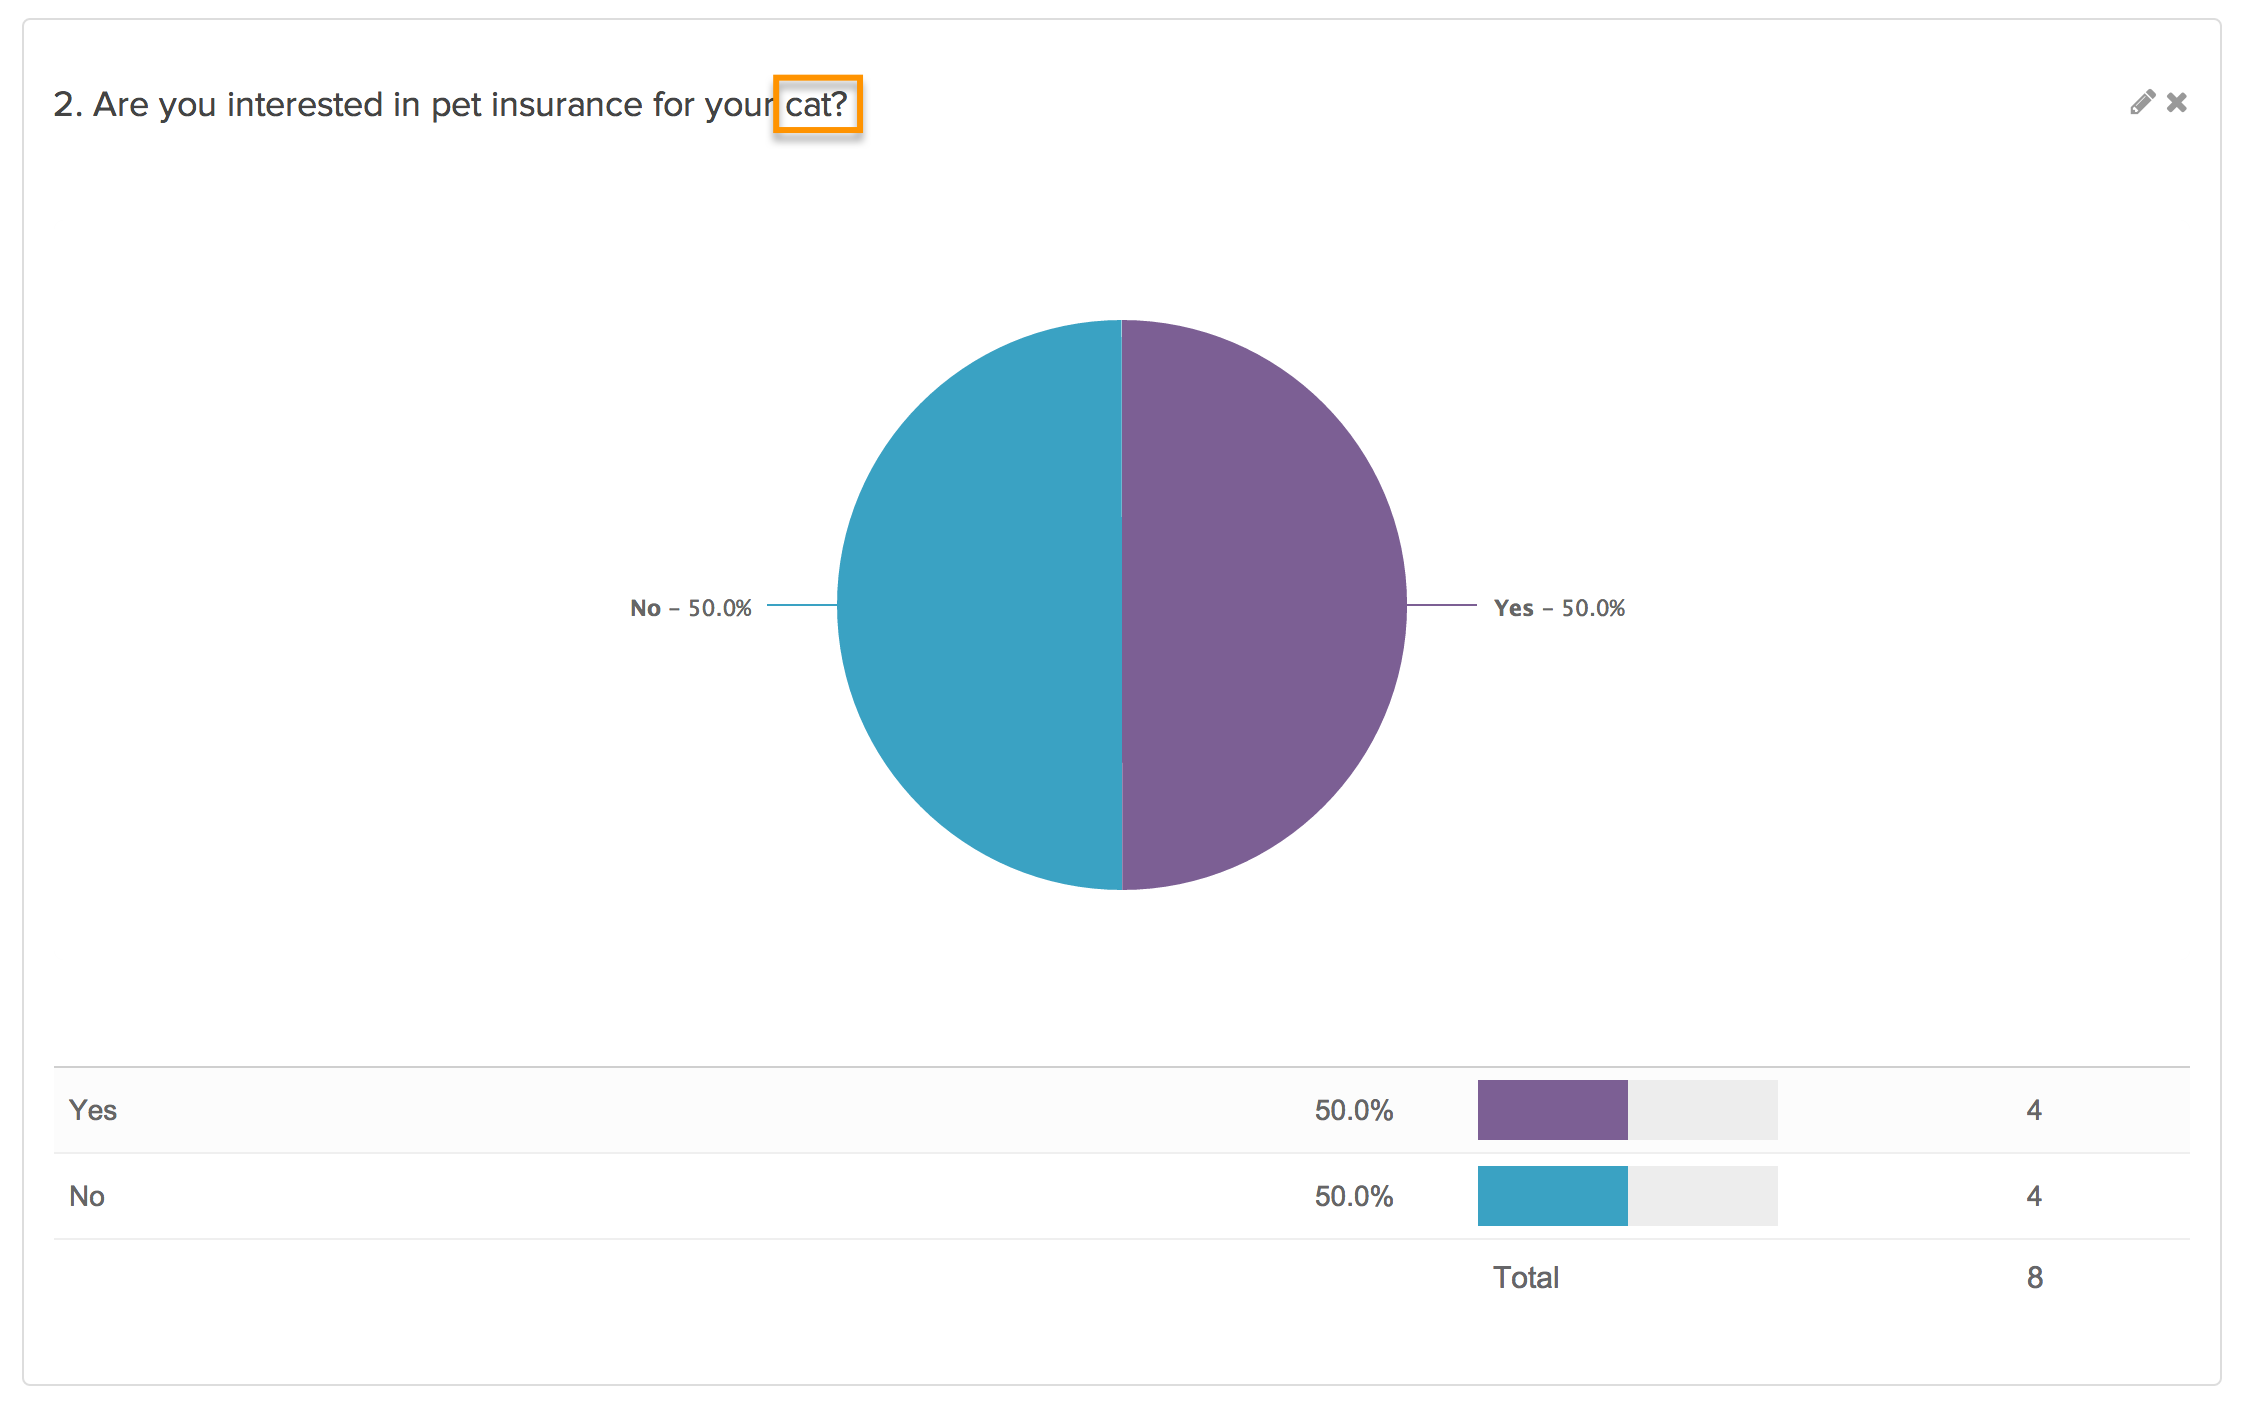
Page Piping
Using page piping you can repeat a page using on the answer(s)(either those that were selected or left unselected) from previous question. Check out our Page Piping Tutorial to learn more!
Standard Report
The Standard Report will automatically create segments based on the source question option so that you can make comparisons across the responses to the piped question.
Below the segmented chart, you will find a grid providing further information. By default, the grid will be grouped by Source Option (from the source question).
Note: Be careful to consider the source question you are piping from. If there are a lot of answer options there will be a lot of data points when reporting.
If you prefer to view your data grouped by Target Option, edit the element via Layout & Options. Locate the Piped/Repeated Question Options section and select Target Option under the Group Piped/Repeated Charts by menu.
This setting can alos be toggled via Overall Options > Charts > Group Piped/Repeated Charts by. The result is as follows:
Group By Target Option
Group By Source Option (Default)
Legacy Summary Reports
Because page piping repeats the piped page and all of its questions, the report will include the page and all its questions for each answer option in the source question that was piped. Be very careful to consider the source question you are piping from. If there are a lot of answer options this can create a lot of data points when reporting.
Legacy Summary Report: Editing the Piped Page Container
Summary Reports use a reporting element called the Piped Page Container to report on piped pages. Below we'll cover how it works and some options for customizing page piped data in your summary reports.
To check out the Piped Page Container click Customize Report inside of your summary report. On the General tab you will see your Piped Page Container with your page name in your list of Report elements. In our example we used the page piped title merge code to name our page so that is what displays in the example below. To edit the Page Piped Container click the title.
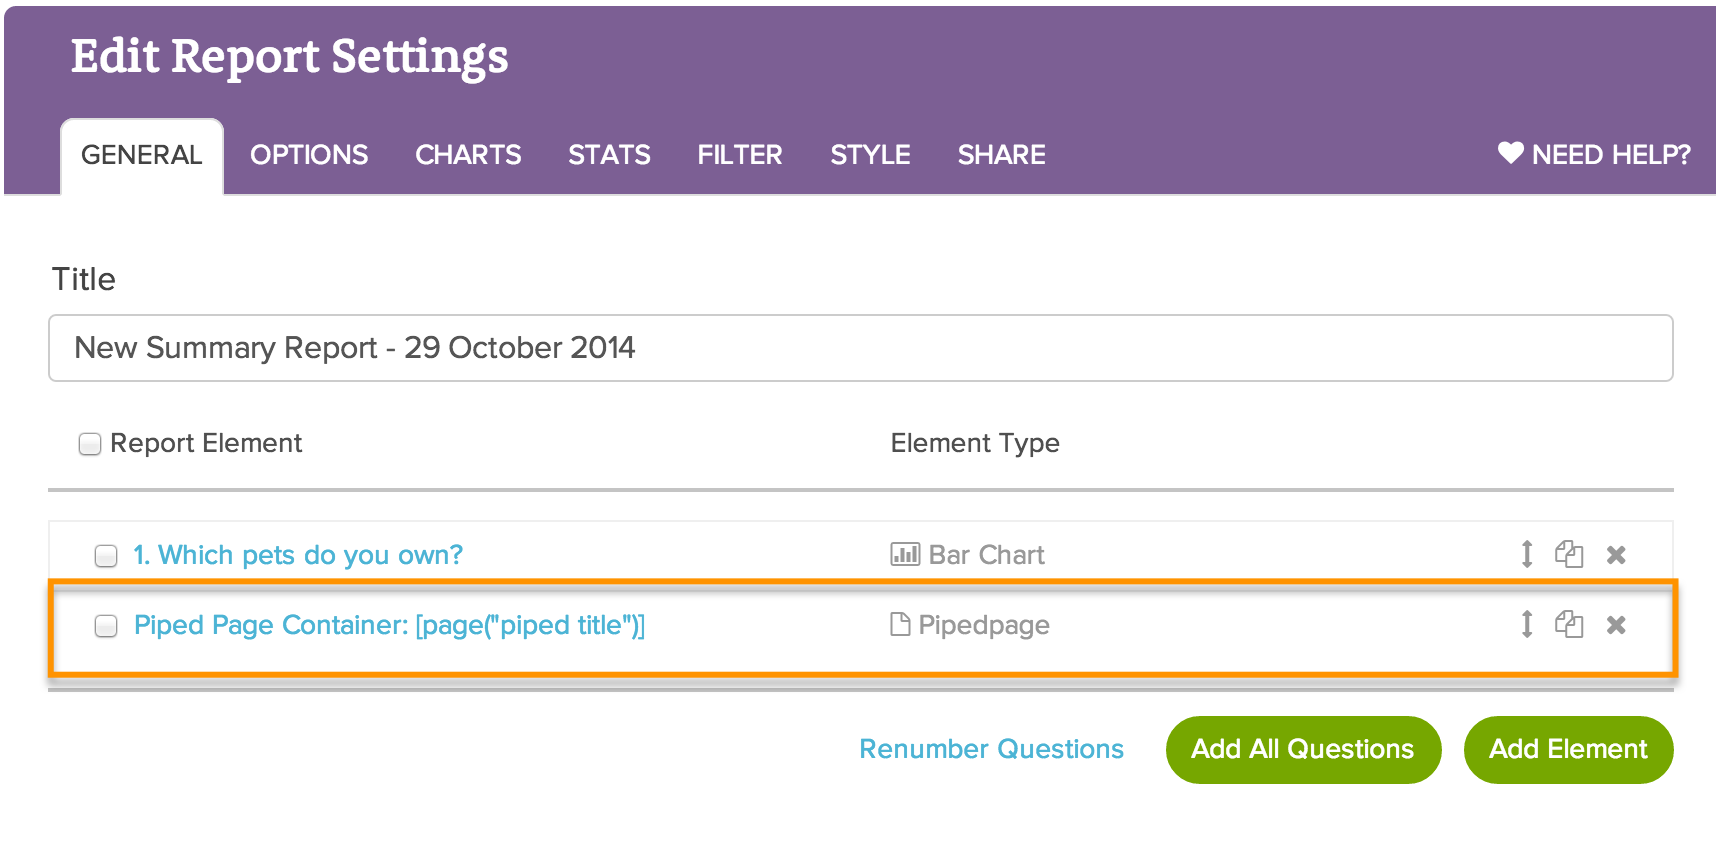
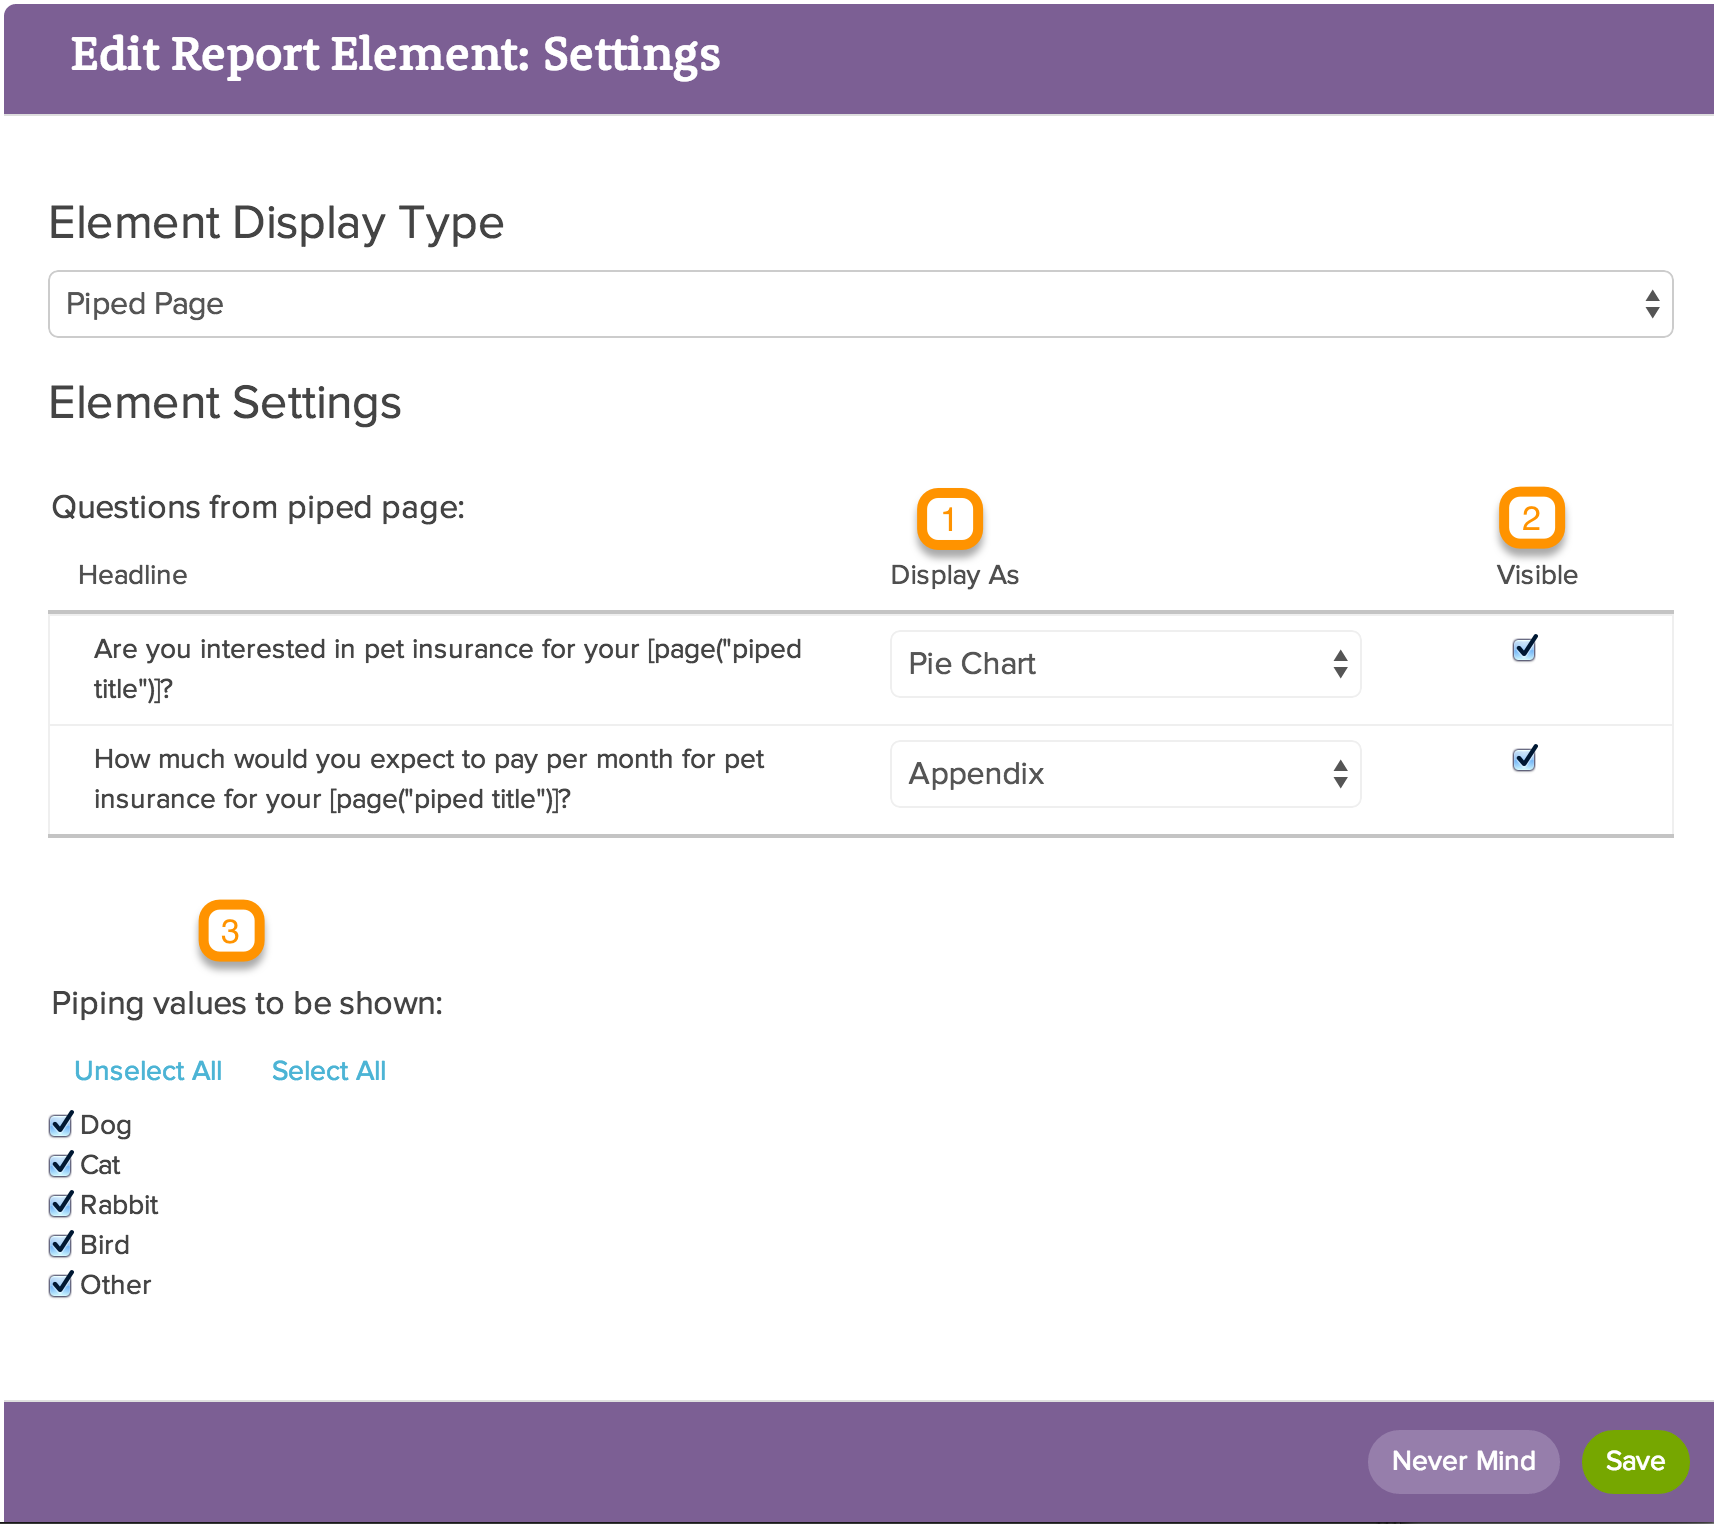
From here you can edit the following:
1. The chart type for each question, pie chart, bar chart or appendix. Keep in mind data compatibility when editing these changes (check out our Summary Report Chart Types Tutorial for more info).
2. The questions on your piped page that are visible. Those selected will display in your report those unselected will not be included in your report. Note, we have an open text question available to show or hide here this is included on report creation by selecting the option to Include Open Text.
3. The values of your piping source you wish to report on.
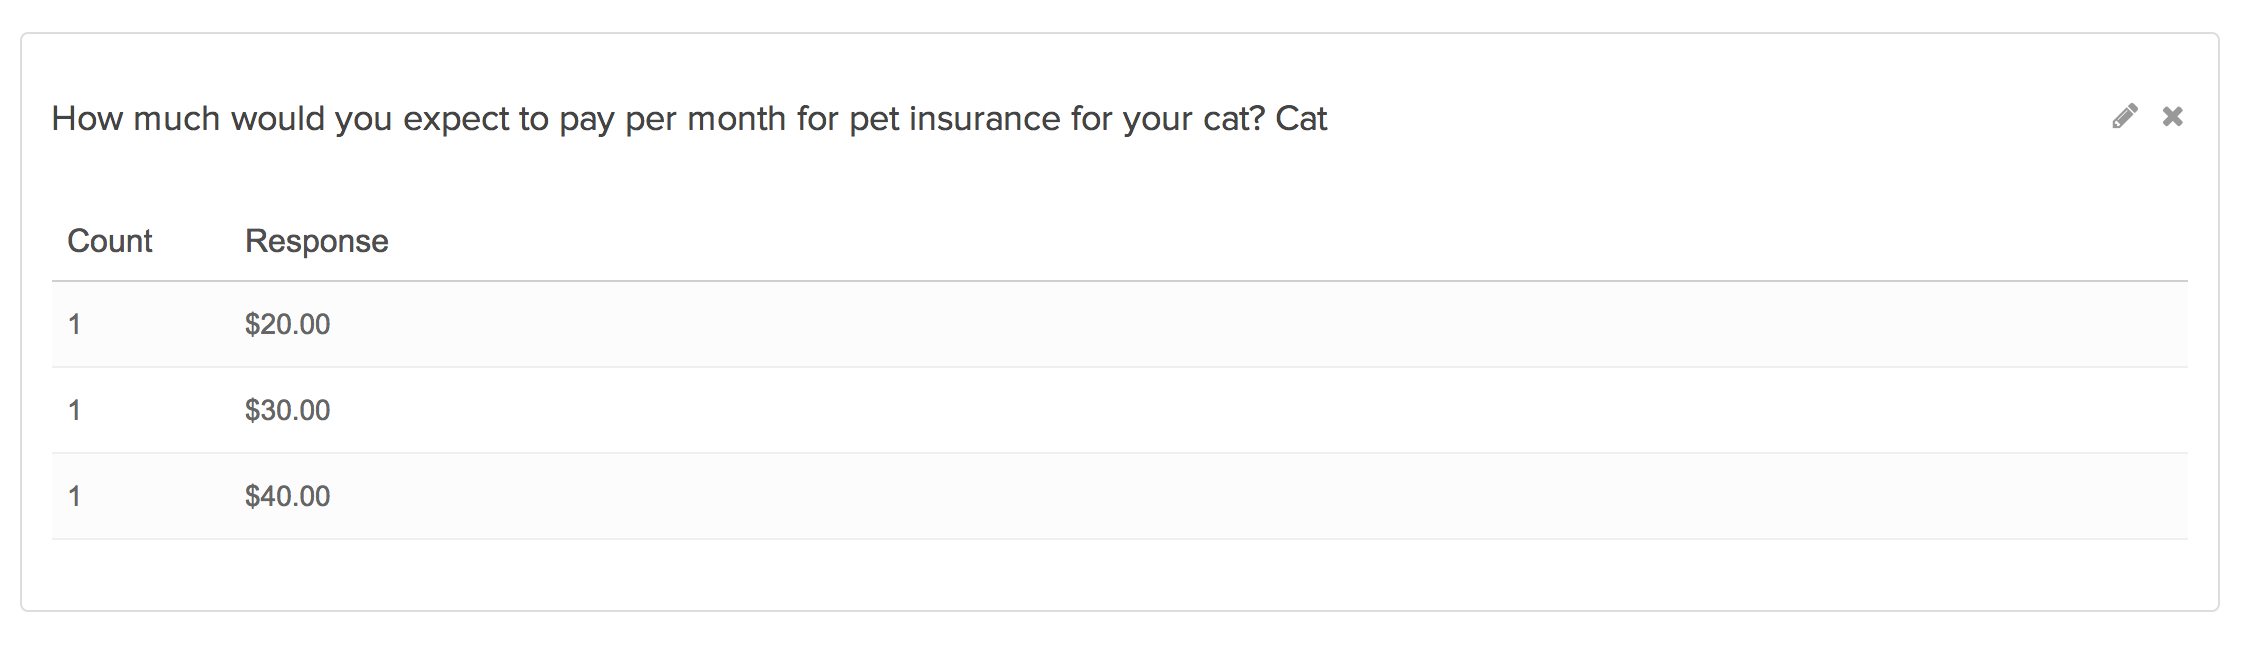
Exports
A column of data per question on the piped page is created for each answer option that was selected in the source question in the CSV/Excel export of your raw data. Be very careful to consider the source question you are piping from. If there are a lot of answer options this can create a lot of data points when reporting.