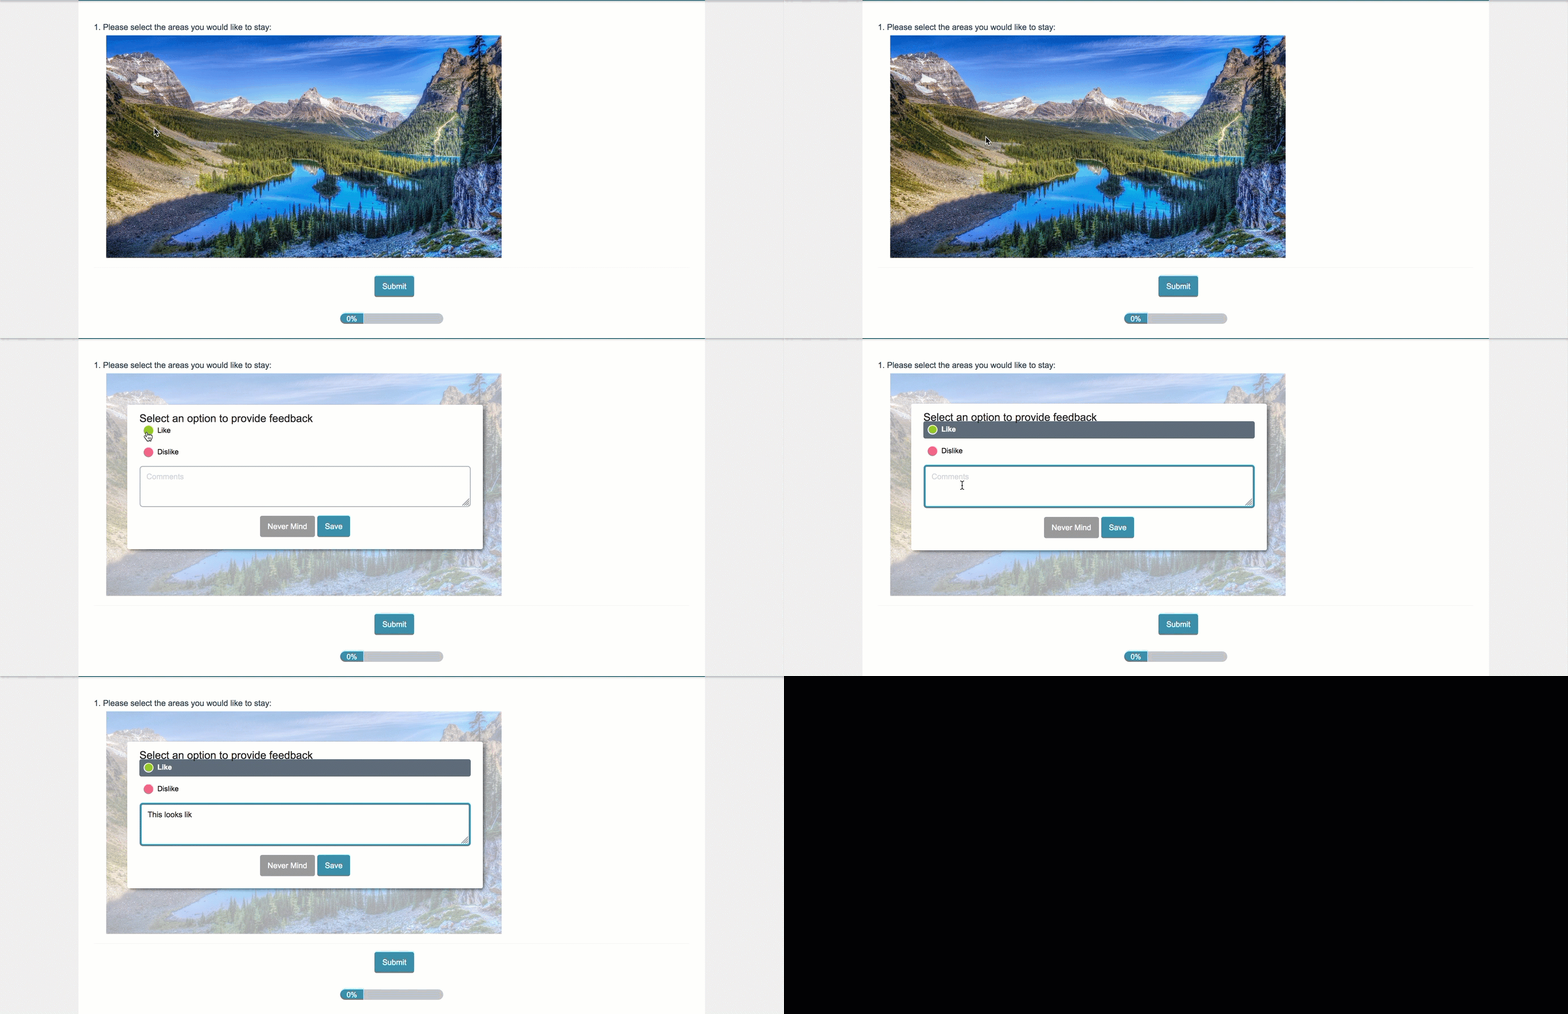
 Check it out in an example survey!
- Add a survey with this question to your account!
The Image Heatmap question type allows your survey respondents to provide feedback on an image. Respondents can click anywhere on that image and select answer options you provide e.g. Like, Dislike.
You can also allow respondents to comment on their selections to provide additional context.
If you want similar functionality for a paragraph of text, check out our Text Highlighter question type.
When To Use It
The Image Heatmap is quite flexible and has a number of potential applications, for example:
- Use the Image Heatmap to gather feedback on a new webpage layout - ask respondents what section of the page they would click to access a specific part of your website to test how intuitive the design is.
- The Image Heatmap can help you perform research on a new product (concept testing). Ask your respondents to indicate what they like/dislike about your upcoming product.
Setup
- Click the Question link on the survey page where you would like to add the Image Heatmap question.
- Select Image Heatmap from the Question Type dropdown and enter your overall question text.
- Click on the image placeholder to add your image. If you have previously uploaded your image to your File Library, you can access it here. You can also upload your image directly to the question.
For the best results, you need to use a square image (or nearly square image).
4. Customize your Heatmap Options as well as the associated color. Choose the color by clicking on the color selector (highlighted below). This will be the color of the click marker visible to your respondents after they have selected an option to categorize their click.
If your Image Heatmap question contains only one option, the option will be automatically selected when the respondent clicks on your image.

Heatmap Options
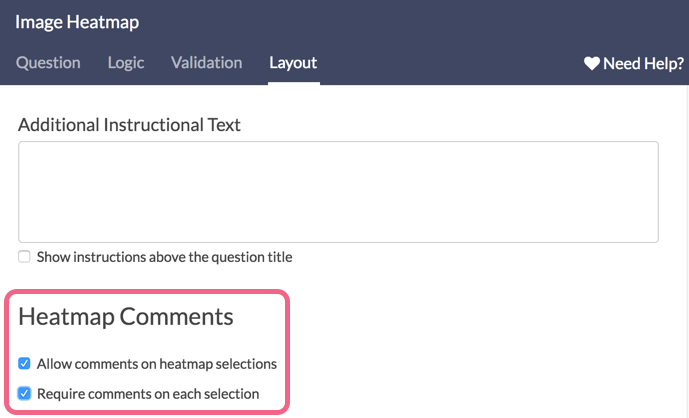
The Image Heatmap question allows you to gather comments on heatmap selections (the comments can also be required). These options are available on the Layout tab.
Comments are enabled by default.
Validation Options
There are a couple validation settings that are unique to the Image Heatmap question.

If you have enabled comments on the question's Layout tab, you can limit the number of characters that can be entered by your respondents into the comment field. Once enabled, a comment box is available for each click on the image.
You can also limit the amount of clicks that a respondent can make on your image. Simply specify a number in the Max Highlights / Points Per Response field.
Both the Max Character Count and Max Points Per Response options are blank by default.
Customize Comments Instructions
If enabling comments for your Image Heatmap question, respondents will see the following default instructions:
"Select an option to provide feedback."
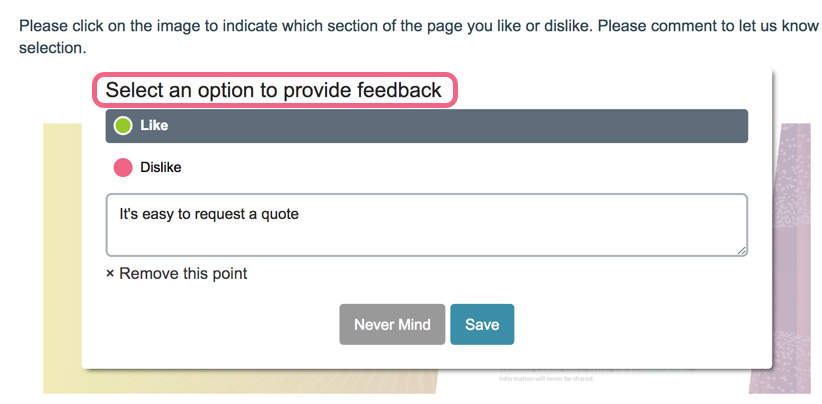
You can customize these instructions via Tools > Text & Translations. Click on the language version that you wish to edit and locate the specific Image Heatmap question that you want to customize. Click edit and update the text in the Comment Description field.
To translate the Save and Cancel button text, head to Tools > Text & Translations and navigate to the Save & Continue tab. Locate the Save and Cancel buttons in the list and make your customizations before saving.
Survey Taking
On a desktop and most laptops the Image Heatmap question looks like so.
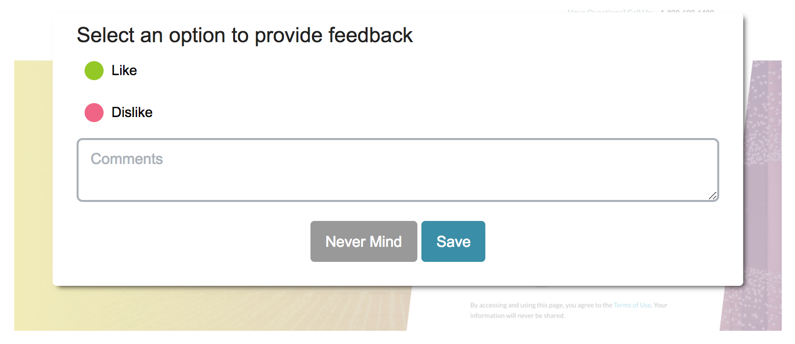
When respondents can click on the image an overlay with the heatmap options and comment field. Clicking Save will capture the point on the image.
Mobile Interaction
The Image Heatmap mobile interaction will be the same as the desktop interaction. The respondent will make their selection by touching the image on their mobile device.
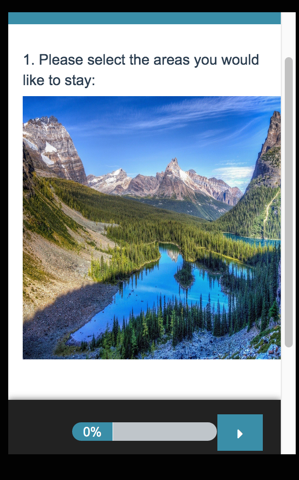
The image cannot be resized while taking the survey on a mobile device.
Removing a Selection
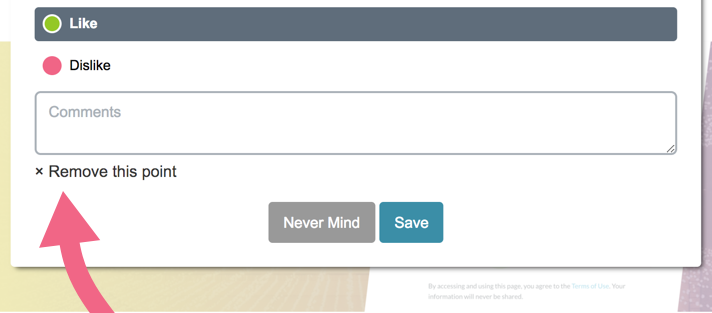
If a respondent wants to remove one of their Image Heatmap selections, this can be done by clicking on that selection and choosing the Remove this point option. Clicking Cancel will take the respondent back to the image.
Reporting
The Image Heatmap question reports as a heatmap element showing aggregated data of your respondents' clicks plotted across your image. The areas of your image with a high density of respondent clicks will be indicated by color intensity (the more red the color, the more respondents have clicked on that area relative to other areas of the image).
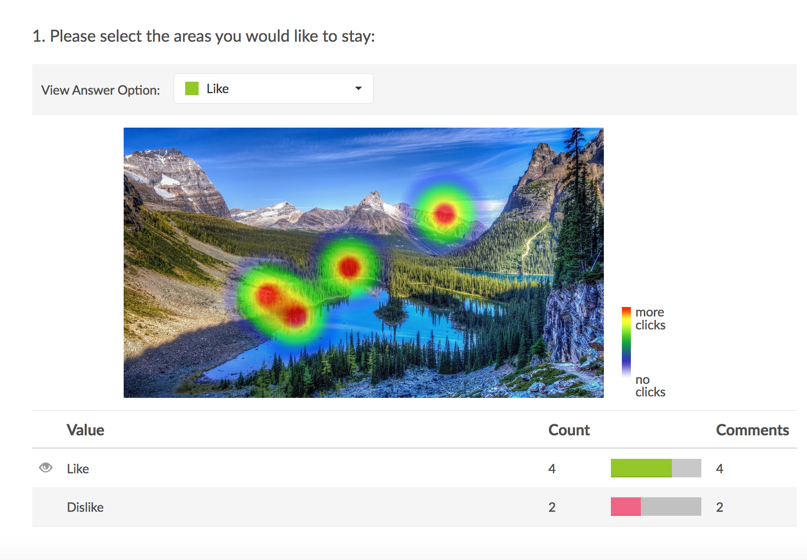
The reporting element allows you to toggle between your Heatmap Options to view the click distribution per option (e.g. Like or Dislike).
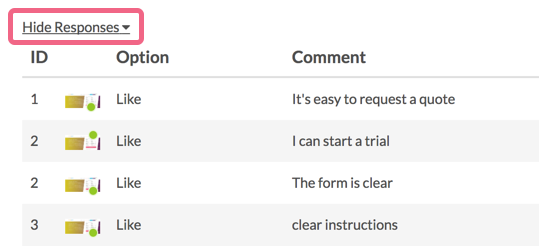
You also have the ability to view clicks and comments per response ID (the details can be toggled via the Show/Hide Responses options and display 20 per page). These are hidden by default.
A Note About Heatmap Reporting
In order to ensure that your Image Heatmap data is not skewed by one respondent's repeated clicks on the same area of an image, Alchemer places lower weight on clusters of clicks by one respondent. Lets take a closer look at what this means in the below scenario.
One of your survey respondents clicks several times on one area of your image and clicks once on another area. They select the same heatmap option for all clicks - "Like" (represented by green click markers in the image below):
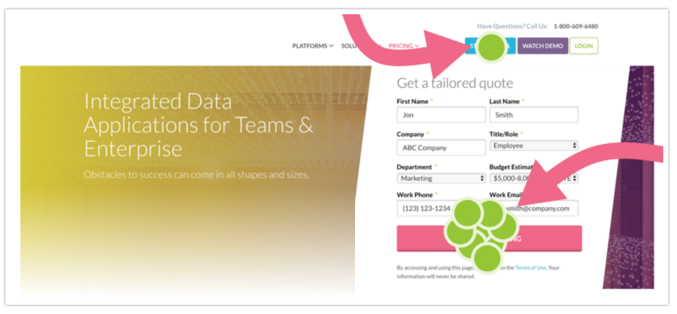
The resulting report output is as follows:
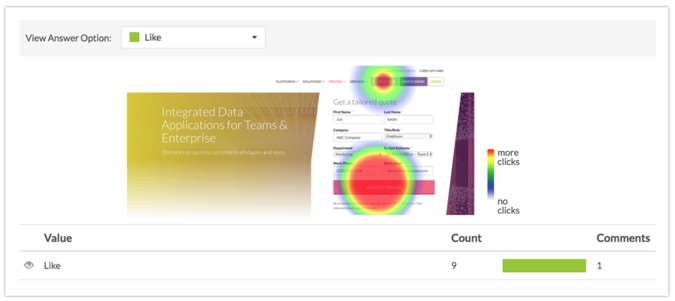
Note that the color intensity is equal for the two click zones (meaning they are equally weighted). Now, the next respondent comes along and clicks on the following part of the image and selects the Like option (they click on the exact spot as the previous respondent):
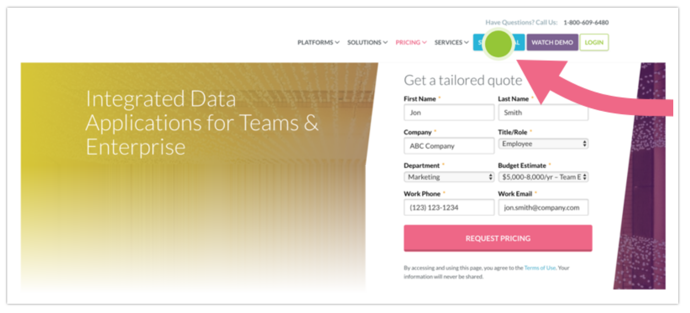
Now, we see the following change within our report:
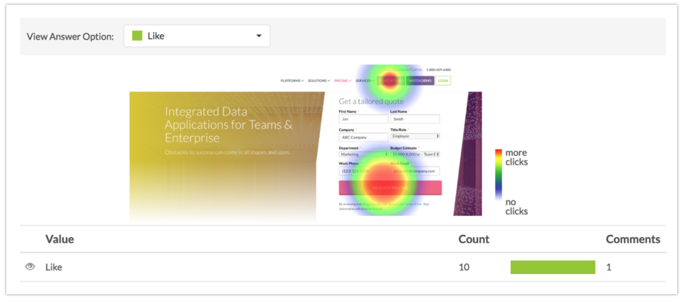
The area of the image that the second respondent clicked is now showing a more intense color. This is due to this area having been selected by multiple respondents, whereas the area with less intensity has been selected by one respondent.
See additional compatible chart types
Within the Standard Report there are various chart types available for visualizing your data. The below grid shows which of the chart types Image Heatmap questions are compatible with.
See what other report types are compatible
The below grid shows which of the report types Image Heatmap questions are compatible with. If you plan to do some specific analysis within Alchemer this report compatibility chart should help you choose the right question types!
| Report Type | Compatible |
|---|---|
| Standard | |
| Legacy Summary | |
| TURF | |
| Profile | |
| Crosstab | |
| Comparison |
Exporting
The Image Heatmap exports as coordinates, the Option ID of the selected Heatmap Option (Like or Dislike for example), and the comment associated with that click.

Let's take a closer look the above raw data output for clarification:
0 1 : x - 304 / y - 267 2 / xPercent - 32.10 / yPercent - 61.66 3 / gridX - 32 / gridY - 61 4 / answer - 10001 5 / comment - I love the website art 6
1. The "0" indicates the first click on the image by a single respondent. Should the respondent click on the image a second time, this would be indicated by a 1 and so on.
2. The x and y values are dependent on the size of your image in pixels.
- The x value increases from left to right.
- The y value increases from top to bottom.
- In the example above we count 304 pixels from left to right for the x value and 267 pixels from the top to the bottom for the y value.
Note: When accessed via a mobile device (tablet, smart phone), the image will be resized to fit the smaller screen size. The pixels will reflect the re-sized image size. In this scenario, the xPercent and yPercent values will be a better representation of the clicked area.
3. The xPercent and yPercent values are calculated from the top left of the image. In our example the click occurred 32.10% across the image moving left to right and 61.66% moving down the image (top to bottom).
4. The gridX (left to right) and gridY (top to bottom) values are based on a 100 x 100 grid (counted from the top left of the image).
5. The "answer - 10001" data refers to the Option ID of the Heatmap Option that was selected after the click.
6. Last, we see the comment associated with the image click.
Limitations
- The Heatmap image should be a minimum size of 320 x 320 pixels. A smaller image will be forced to the 320 x 320 size and will likely be distorted as a result.
- The Image Heatmap question is not compatible with Offline Mode.
- The Image Heatmap is not compatible with Word and Excel exports of Standard Reports.
A Note About Image Heatmap Data
Editing your heatmap image after collecting survey responses is highly discouraged as it may result in invalidating your data. You will see the following alert when editing the heatmap question after data collection:

If needing to edit the heatmap image, it is recommended that this question is copied and edits are made in the copy. The original can then be disabled.
Please refer to our best practices on editing a live survey.
Net Promoter®, NPS®, NPS Prism®, and the NPS-related emoticons are registered trademarks of Bain & Company, Inc., Satmetrix Systems, Inc., and Fred Reichheld. Net Promoter Score℠ and Net Promoter System℠ are service marks of Bain & Company, Inc., Satmetrix Systems, Inc., and Fred Reichheld.
 Check it out in an

