As of October 31, 2027, Microsoft will no longer support the creation of new real-time streaming models in Power BI, including push semantic models and streaming tiles. Existing models will continue to operate, but no new streaming datasets can be created after this date. Microsoft recommends migrating to Real-Time Intelligence in Microsoft Fabric. Learn more: https://learn.microsoft.com/en-us/power-bi/connect-data/service-real-time-streaming
For our recommendations, jump to this section.
The Power BI Action allows users to push data from Alchemer to utilize several data analytics features in the tool. Microsoft Power BI allows one to make decisions with confidence and leverage data as soon as it is available, offering several methods to visualize information. Use the Power BI Action to push data seamlessly into Power BI and utilize advanced reporting analysis.
NOTE: The Power BI Action in Alchemer utilizes the streaming dataset feature which must be setup in the web-based version of Power BI. Streaming datasets can later be referenced in the desktop version.
There are 3 ways to push Alchemer responses into Power Bi:
- Use the Power BI Action in Alchemer to live stream data.
- Export previously collected responses from Alchemer as a CSV and import the CSV into Power BI
- Utilize a Data Warehouse to pass responses through to connect historical and live streaming data in Power BI.
Live Streaming data into Power BI
Setup
To move live streaming data into Power BI, Alchemer users must use the web-based application of Power BI.
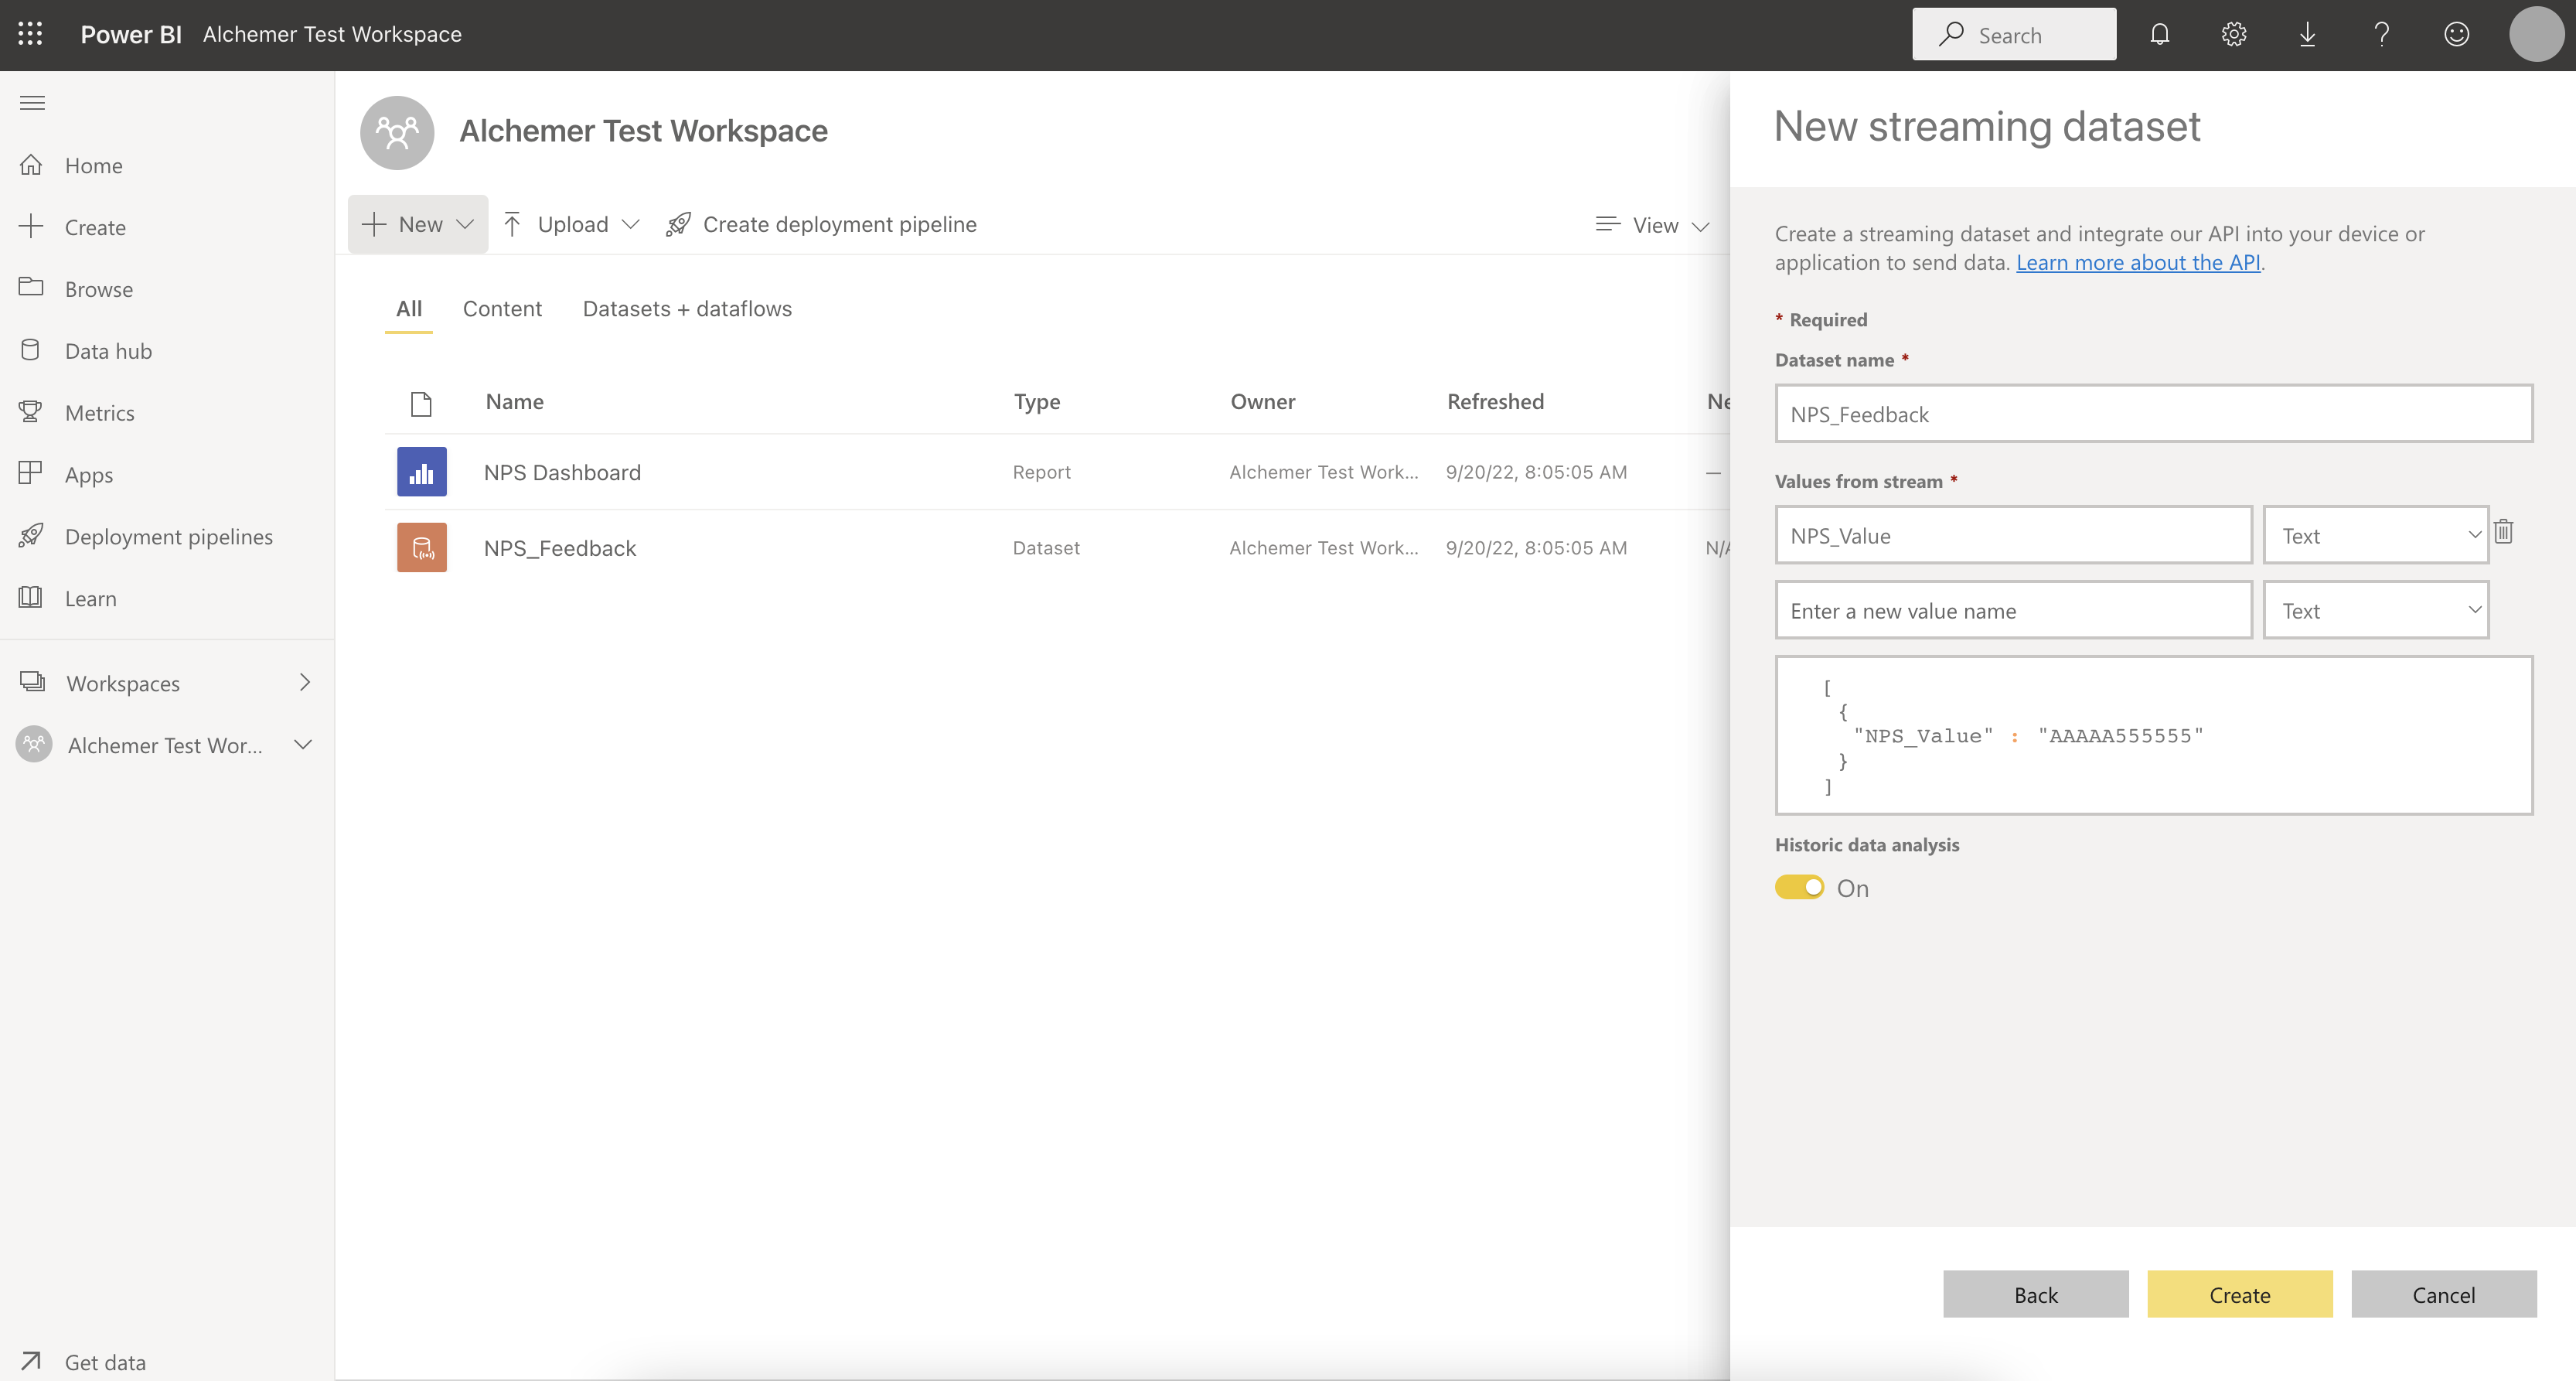
- Mapping data begins with creating a dataset to capture information pushed from Alchemer to Power BI. Start by logging into the dedicated Power BI account. Navigate to My workspace. Select New in the top right of the screen and choose Streaming Dataset > API > Next
- Provide a name for the dataset and the values from the stream. These reflect what exists in the survey where the action will be created. If the question being added is one with numerical values, change the dropdown to read number. To aggregate live responses that will be saved long term in Power BI, turn Historical Data Analysis on. Select Create:
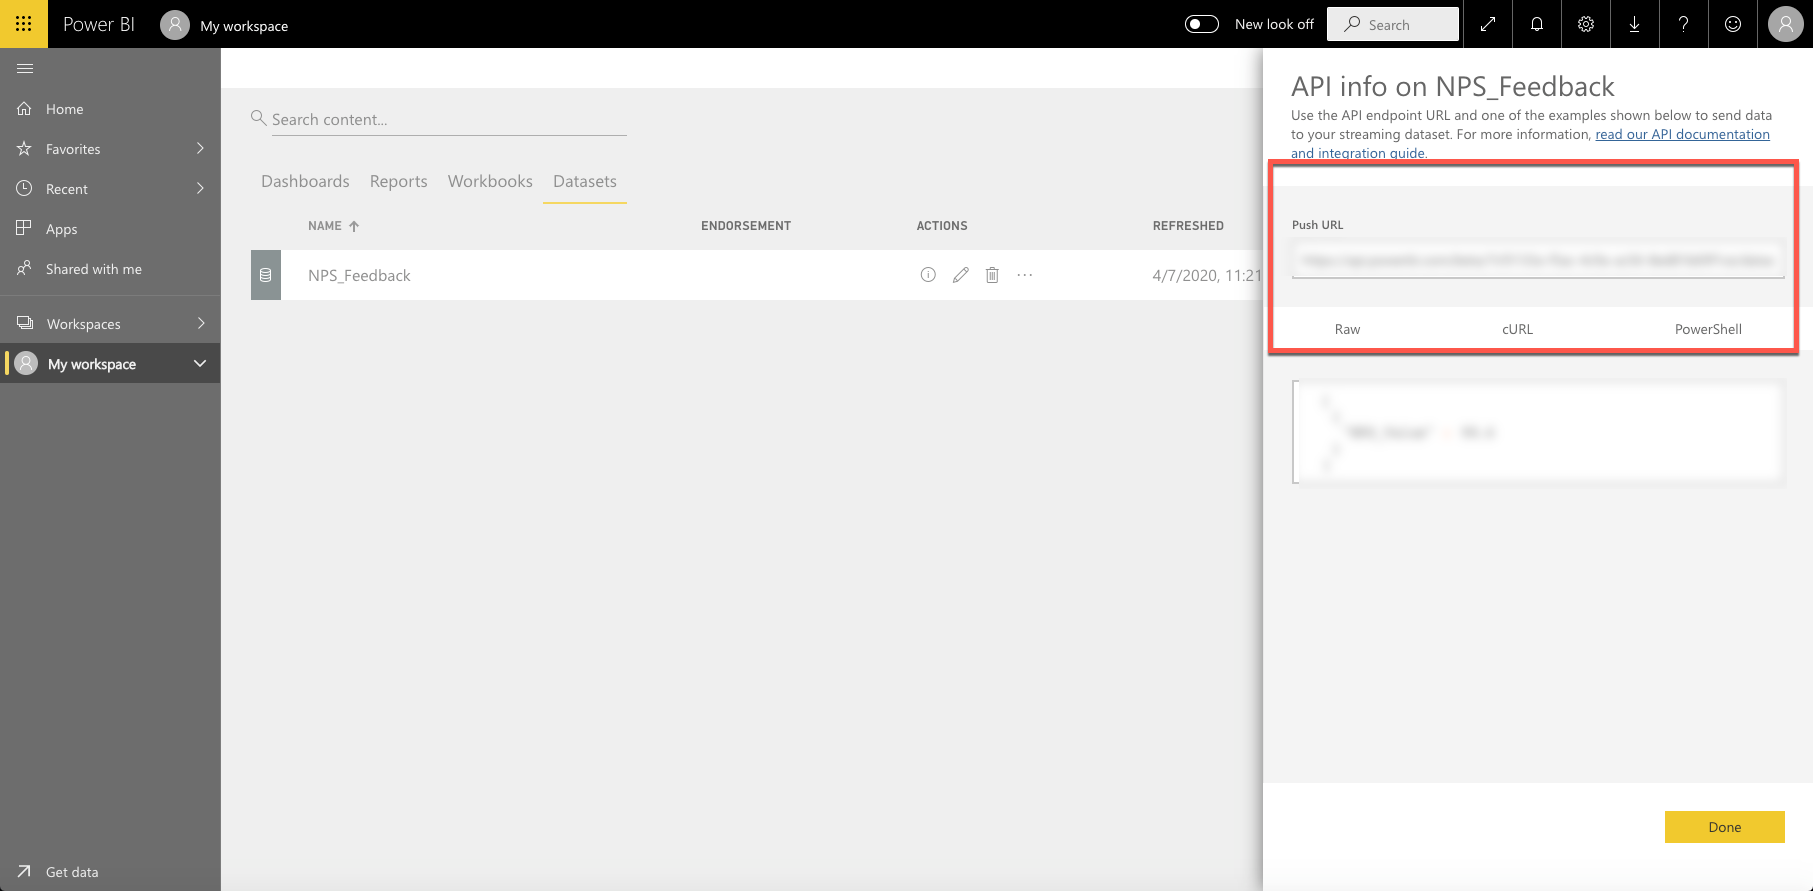
- Choose Next. Copy the Push URL and save it for later use. This is referenced later in the platform to send data to Power BI. Click Done:
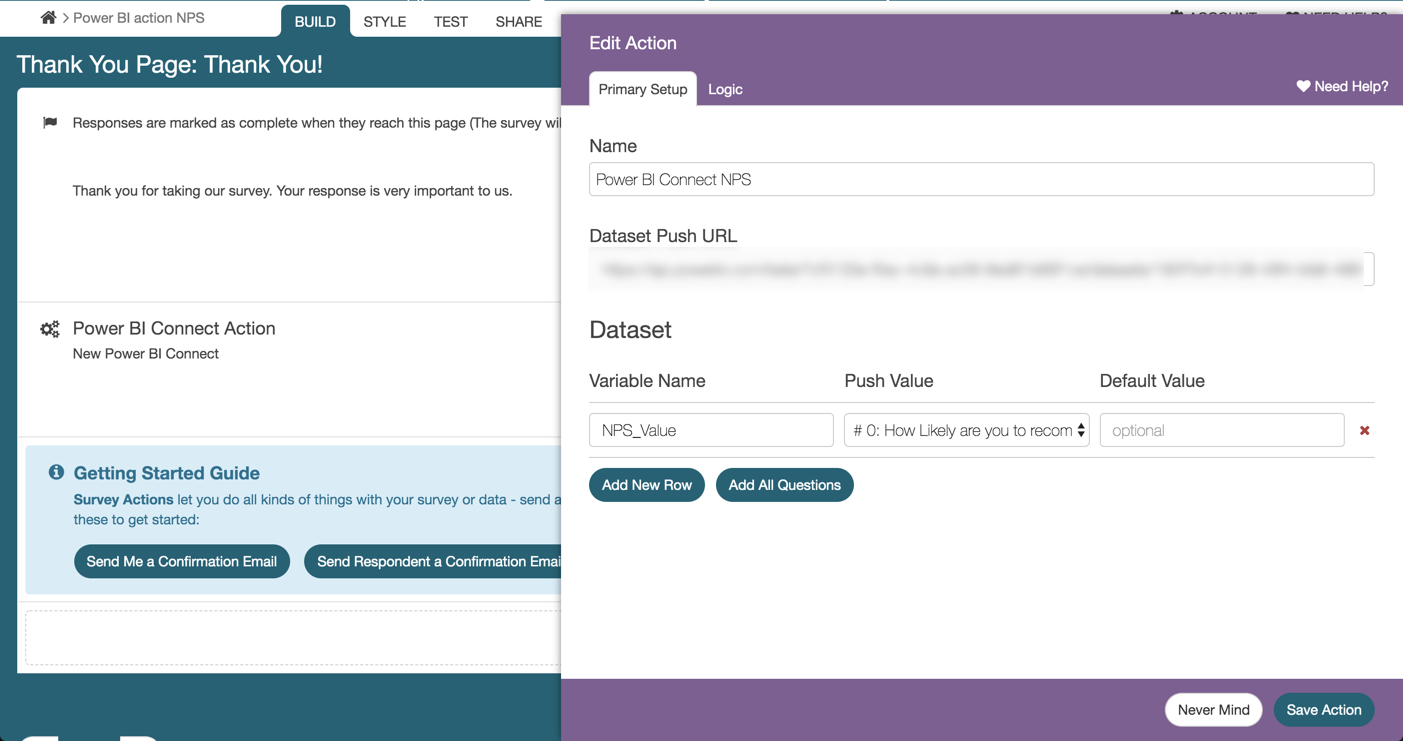
- Navigate back to Alchemer. Add the Power BI Connect Action to the page after the questions one would like to push to Power BI by clicking Action.
- Paste the Push URL from Power BI in the Dataset Push URL text box. Add each question one would like to send to Power BI. Provide the Values to Stream Name that was created earlier in step 2 in Power BI in the Variable Name text box as seen below:
- Navigate back to the Power BI workspace where the Dataset resides. Create a report to store the data from Alchemer using the + New icon in the top left.
- Click on Pick a published dataset and select the applicable dataset. Click Create a blank report as seen below.


- Head back into Alchemer and to the Share tab. Populate a survey response via the Primary Link to see data is being passed into the report. The report can be refreshed to see the data pulled in real time.
For more information on how to leverage Power BI and their analytics, check out Power BI Documentation.
Power BI Desktop - Get Data from the web-based streaming dataset
The Power BI streaming dataset collects all the metadata from the dataflow and is not stored in a table. Reports can be built in the desktop app and reference this metadata.
Setup
- Open up the Power BI Desktop application.
- Click File>Get Data. From the Data Hub, select the live streaming dataset and choose the dataset created from above. Click connect as seen below.

Uploading Previously Recorded Responses from Alchemer into Power BI using a CSV
Power BI allows for CSV files to be uploaded into the platform. This provides Alchemer users the ability to utilize Power BI for previously collected surveys and responses!
Setup
- Log into Alchemer. Select the survey that contains previously collected responses. Choose Results > Exports > CSV/Excel. Select each field Display Option to be included in the CSV File. Select Create Report:
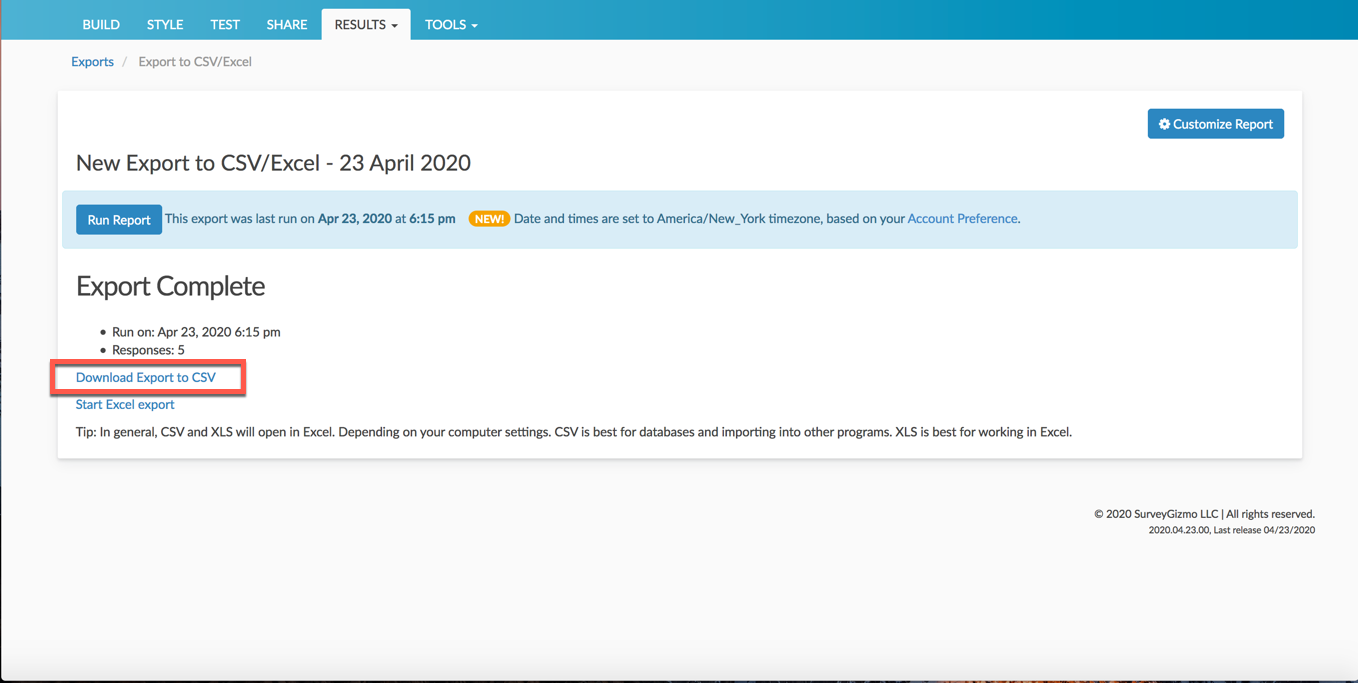
- This displays the Edit Report Settings window. Select what questions and data to include in the file. After selecting/deselecting the available fields for the export, click Save. On the Export complete page, select Download Export to CSV:
- Once the file is downloaded and accessible on the device of choice, Navigate into Power BI.
- Within power BI, select Get Data from the navigation menu. Select Get from the Files tile. Choose the source of the file for upload:
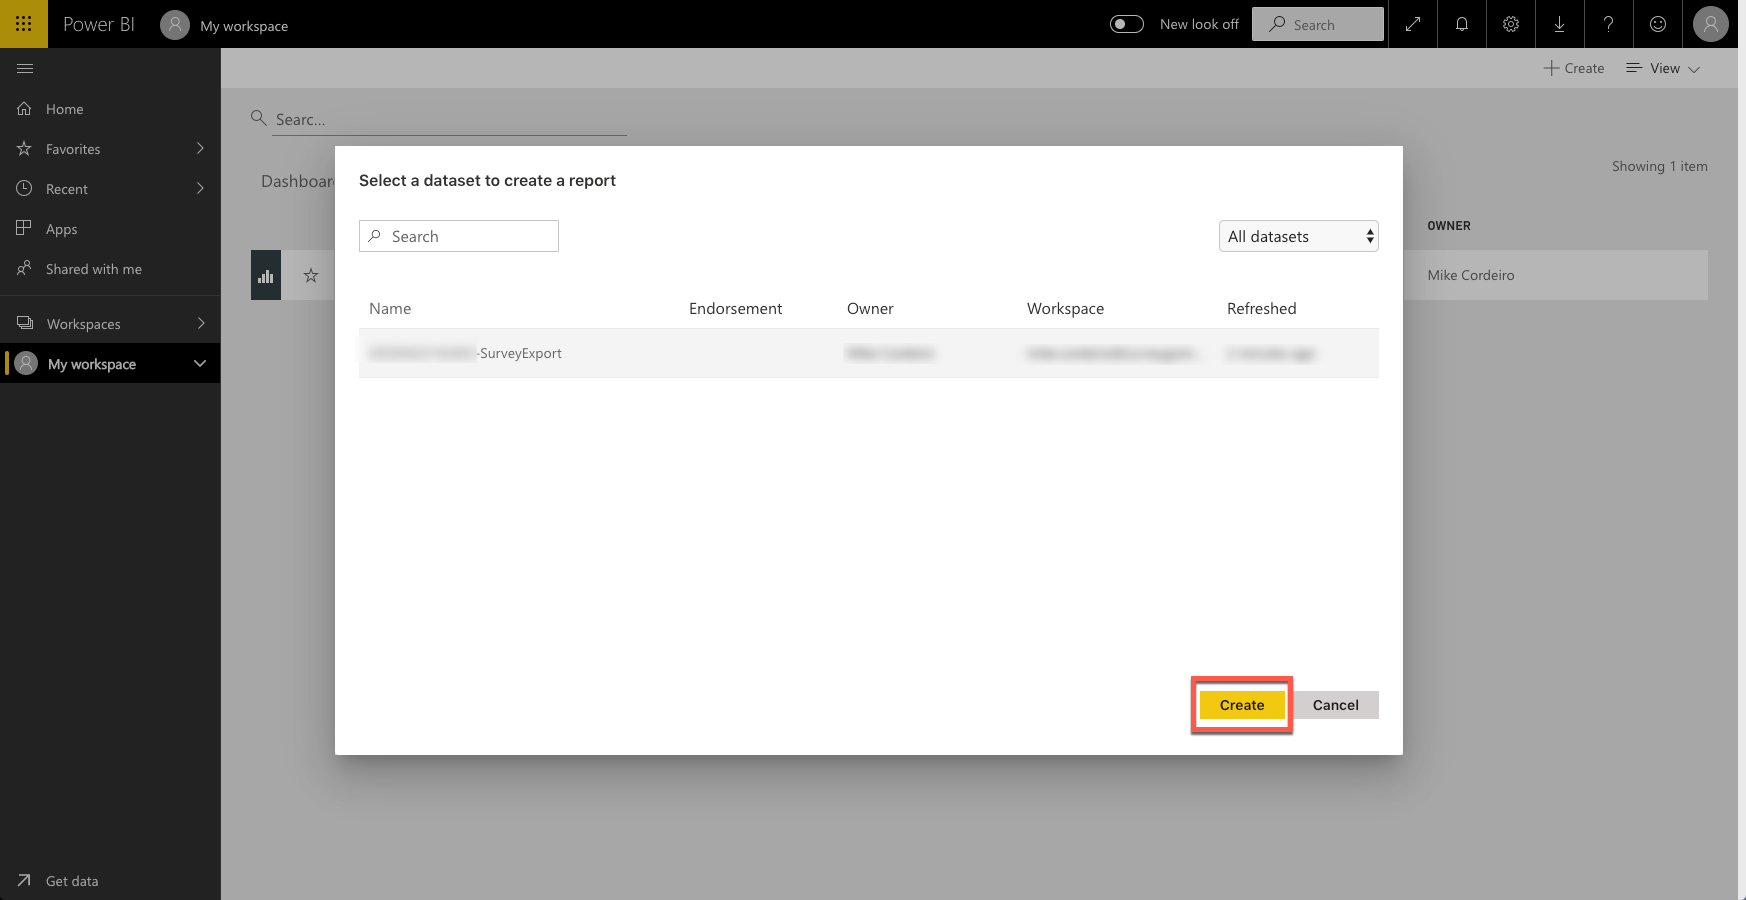
- Once pulled into Power BI, Select Create>Report. Choose a dataset to create the report. The file uploaded into Power BI is listed here. Click the dataset and select Create:
- This brings one to the reports page where users create custom visualizations of their data. First select the visualization of choice from the menu on the right. The Fields section represents the columns that exist in the CSV file.
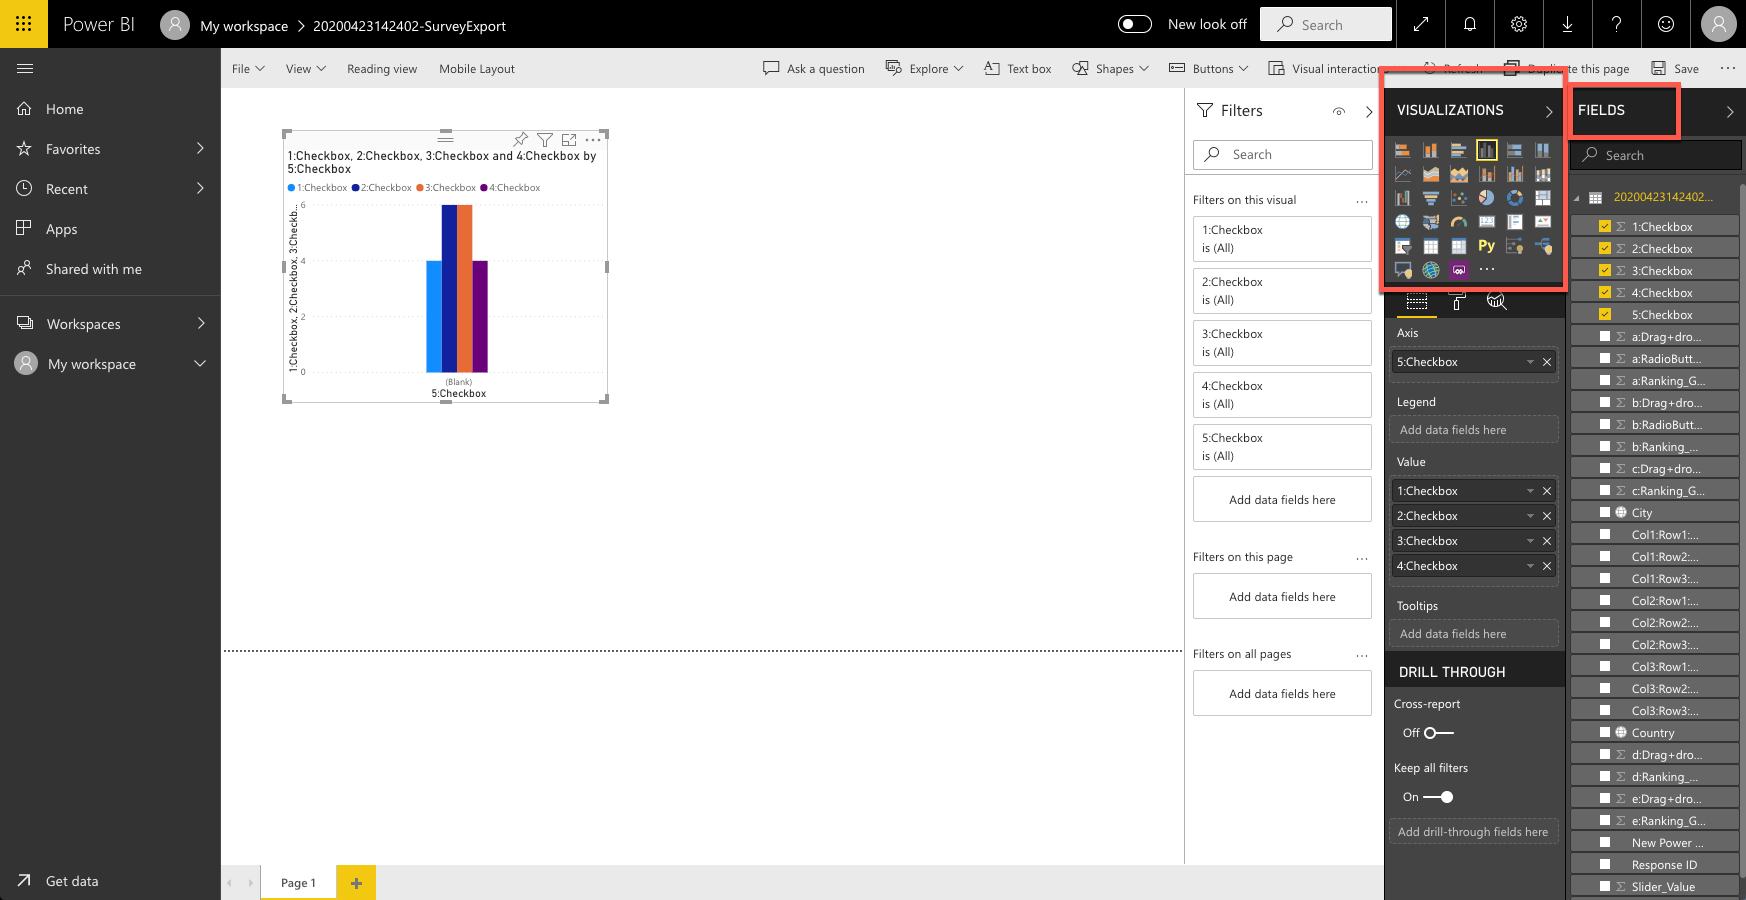
- When a visualization is selected, a blank chart will display in the section below the menu items. Simply drag each column from the fields into each blank chart to start to build visualizations.
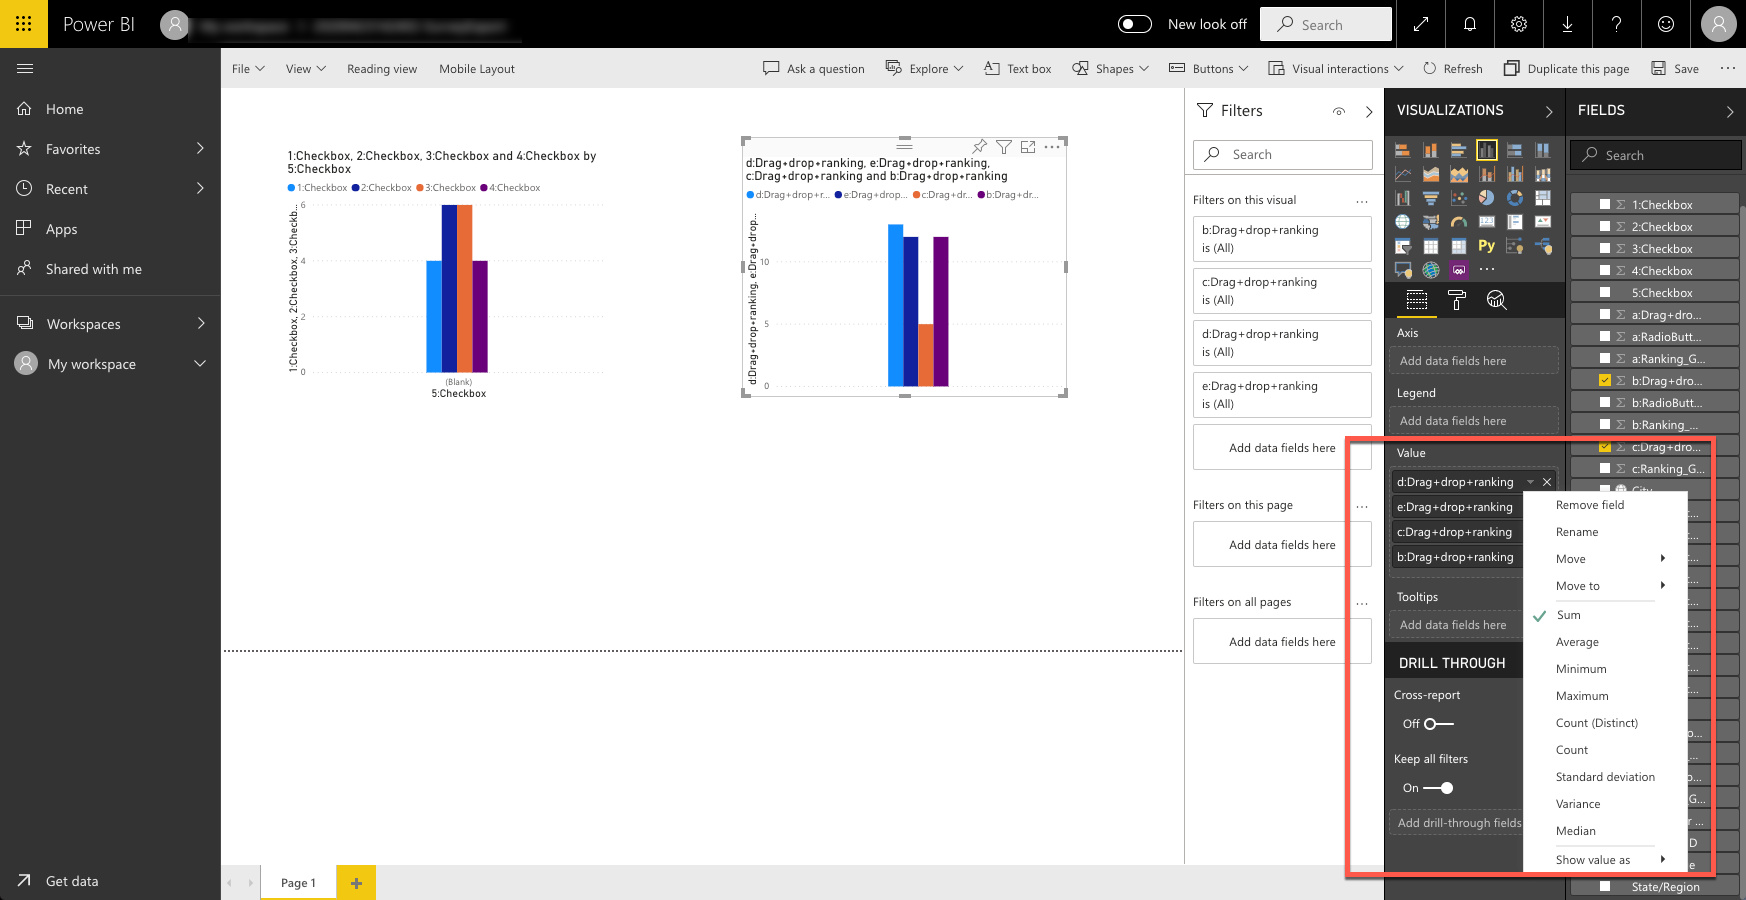
- Once fields exist in a visualization, change the value settings based on user needs. One can rename each value in the chart as well as have charts display the sum, average, standard deviation, variance, and more:


For more information on Visualizations in Power BI Reports, click here.
Limitations
- Re-firing the Power BI Action does not update or change alterations in a response that was previously collected.
- The Power BI Action is not compatible with answer option piping.
- Desktop Application of Power BI cannot be used to stream live data.
- Historical data imports cannot be combined with live streaming datasets.
- Power BI REST API Limitations
Compatible Question Types
- Radio Button
- Net Promoter Score
- Textbox
- Checkbox
- Radio Button Grid (Rows)
- Slider
- Checkbox Grid as visualization
- Drag and Drop
- Hidden Values
Additional Resources
- Get started building with Power BI
- Analyze data with Power BI
- Use visuals in Power BI
Moving Away from Power BI Streaming Datasets: Better Ways to Integrate Your Data
If you're currently using Power BI's streaming datasets to visualize your Alchemer survey data, it's time to start thinking about a more future-proof solution. Microsoft is winding down support for this feature, and we want to make sure your data pipeline stays smooth and reliable. Below are some recommended ways to integrate Alchemer data into Power BI using more sustainable and scalable approaches.
1. Use a Data Warehouse for Enterprise-Grade Power
For organizations that already work with platforms like Snowflake, Azure Data Lake, or Google BigQuery, pushing your Alchemer survey data into one of these environments is a great option. These tools are built for scalability and work seamlessly with Power BI for rich analytics and visualization. If you're managing large volumes of structured data, this is the most robust path forward.
2. Leverage Excel for Lightweight Integrations
Looking for a quick and simple integration? Try using Alchemer’s Excel export or set up a scheduled sync to automatically keep your data up to date. Power BI Desktop connects easily to Excel, making this a perfect choice for smaller teams or less complex reporting needs. It’s low-effort, widely supported, and gets the job done.
3. Connect with Middleware or ETL Tools
If your data needs are a bit more complex—maybe you’re blending survey data with other systems or applying custom transformations—then ETL tools or middleware might be your best bet. Tools like Fivetran, Talend, or even custom-built data pipelines can pull data from Alchemer and push it wherever you need it. These solutions offer a lot of flexibility and can grow with your tech stack.
Why Make the Switch?
Moving away from Power BI’s streaming datasets isn’t just about staying current; it’s about building a more reliable, scalable data strategy. The alternatives we’ve outlined offer more control, better long-term support, and are aligned with modern data practices.
Pro tip: Start transitioning early to avoid any last-minute disruptions when streaming support ends.
Need help planning your move? Reach out to our support team or check out more integration help documents outlined in Alchemer University.