What are Dashboards
You can pin charts and tables to any Dashboard which you created, and those that have been shared with you with the Edit privilege. When you create a Dashboard, you can share it with other people with either the View or Edit privilege. You can collaborate with other users on a Dashboard by commenting and reacting to comments. Dashboards are interactive, allowing you to perform actions like filtering, excluding values, and drill down on the visualizations.
Create a Dashboard
To create a Dashboard:
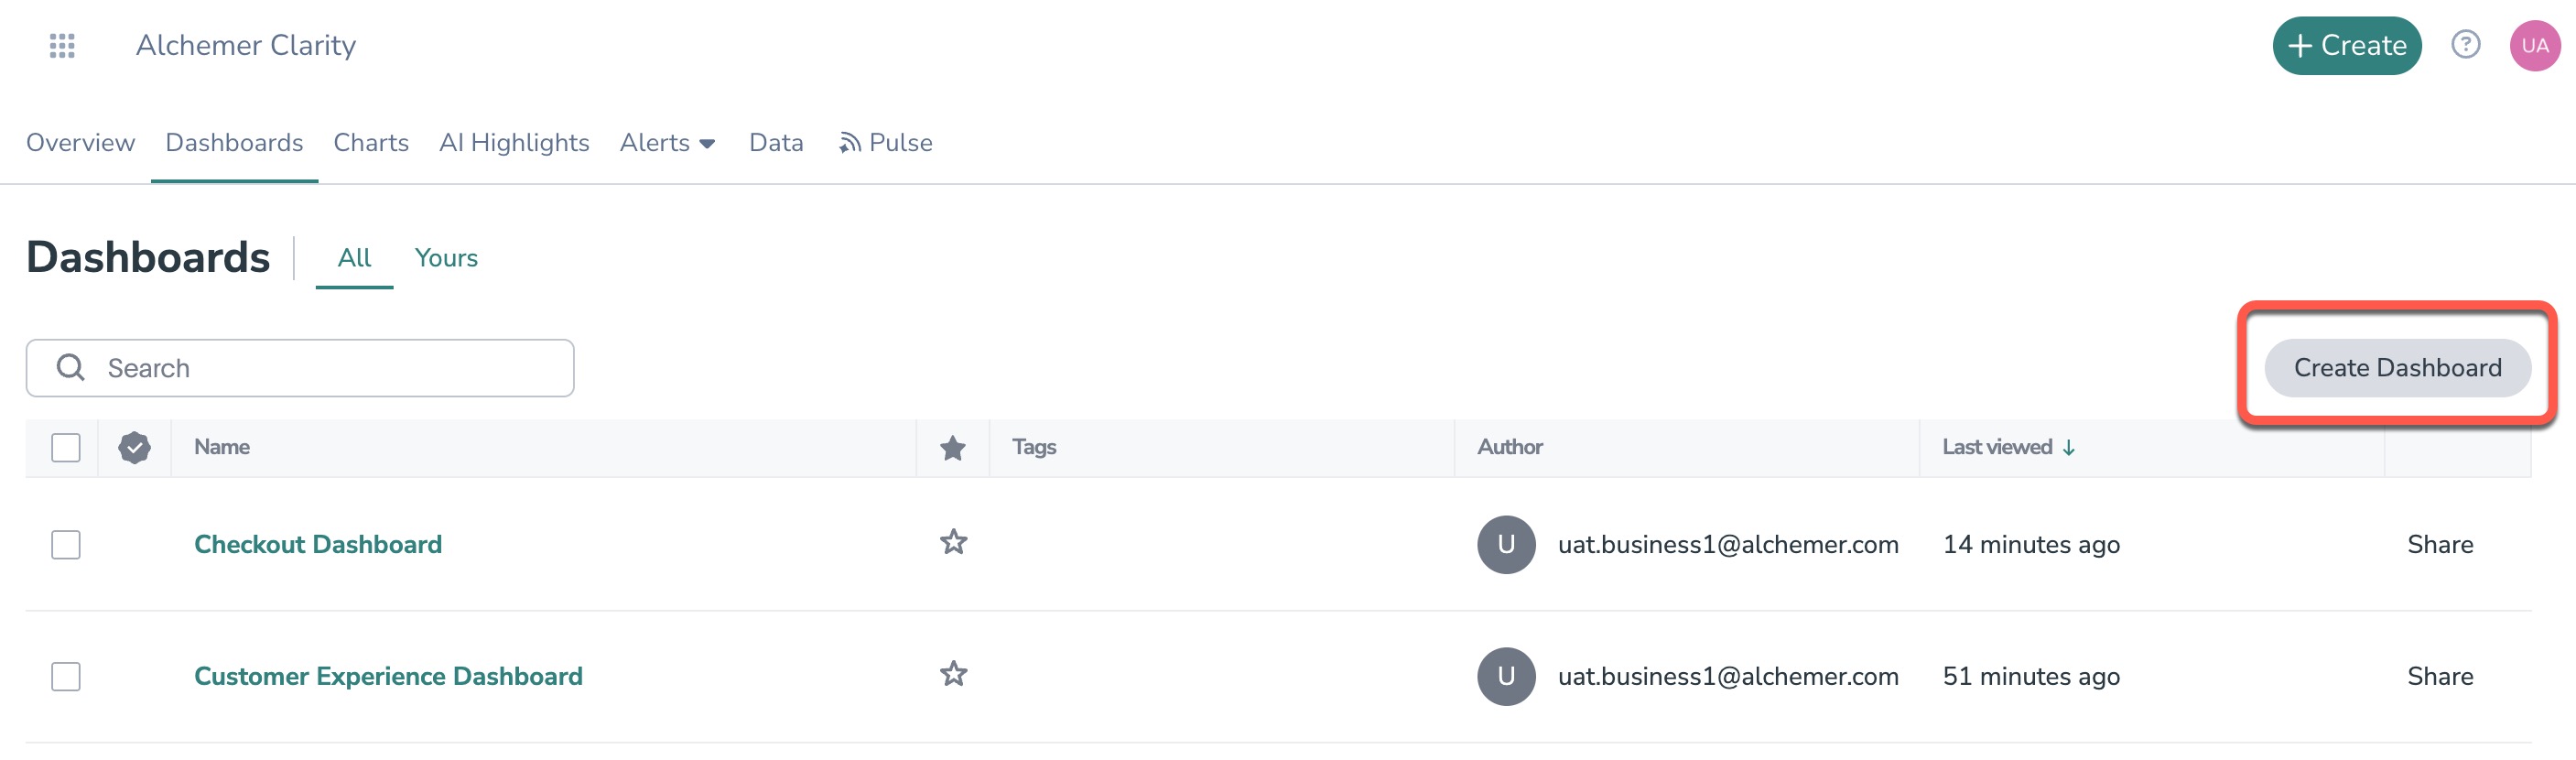
1. Select Dashboard, on the top navigation bar.
2. Select Create Dashboard on the Dashboard list page.
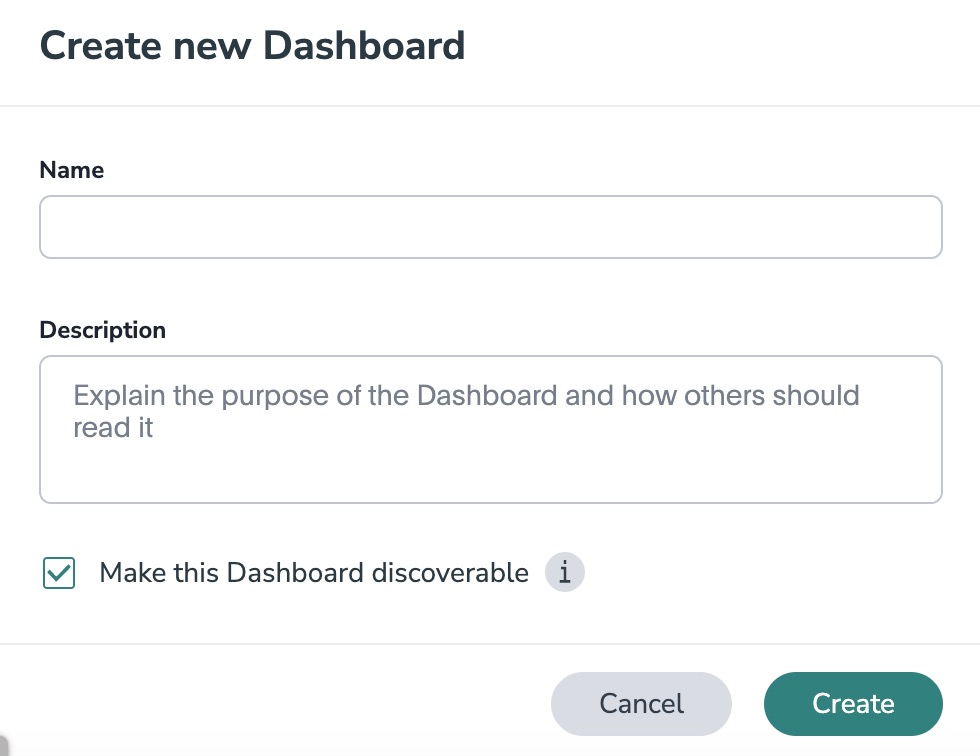
3. In the New Dashboard dialog, give your Dashboard a name and description. Then select Create.
Add a Chart to a Dashboard
Instead of saving a Chart you can add it to a Dashboard. To add a Chart to a Dashboard:
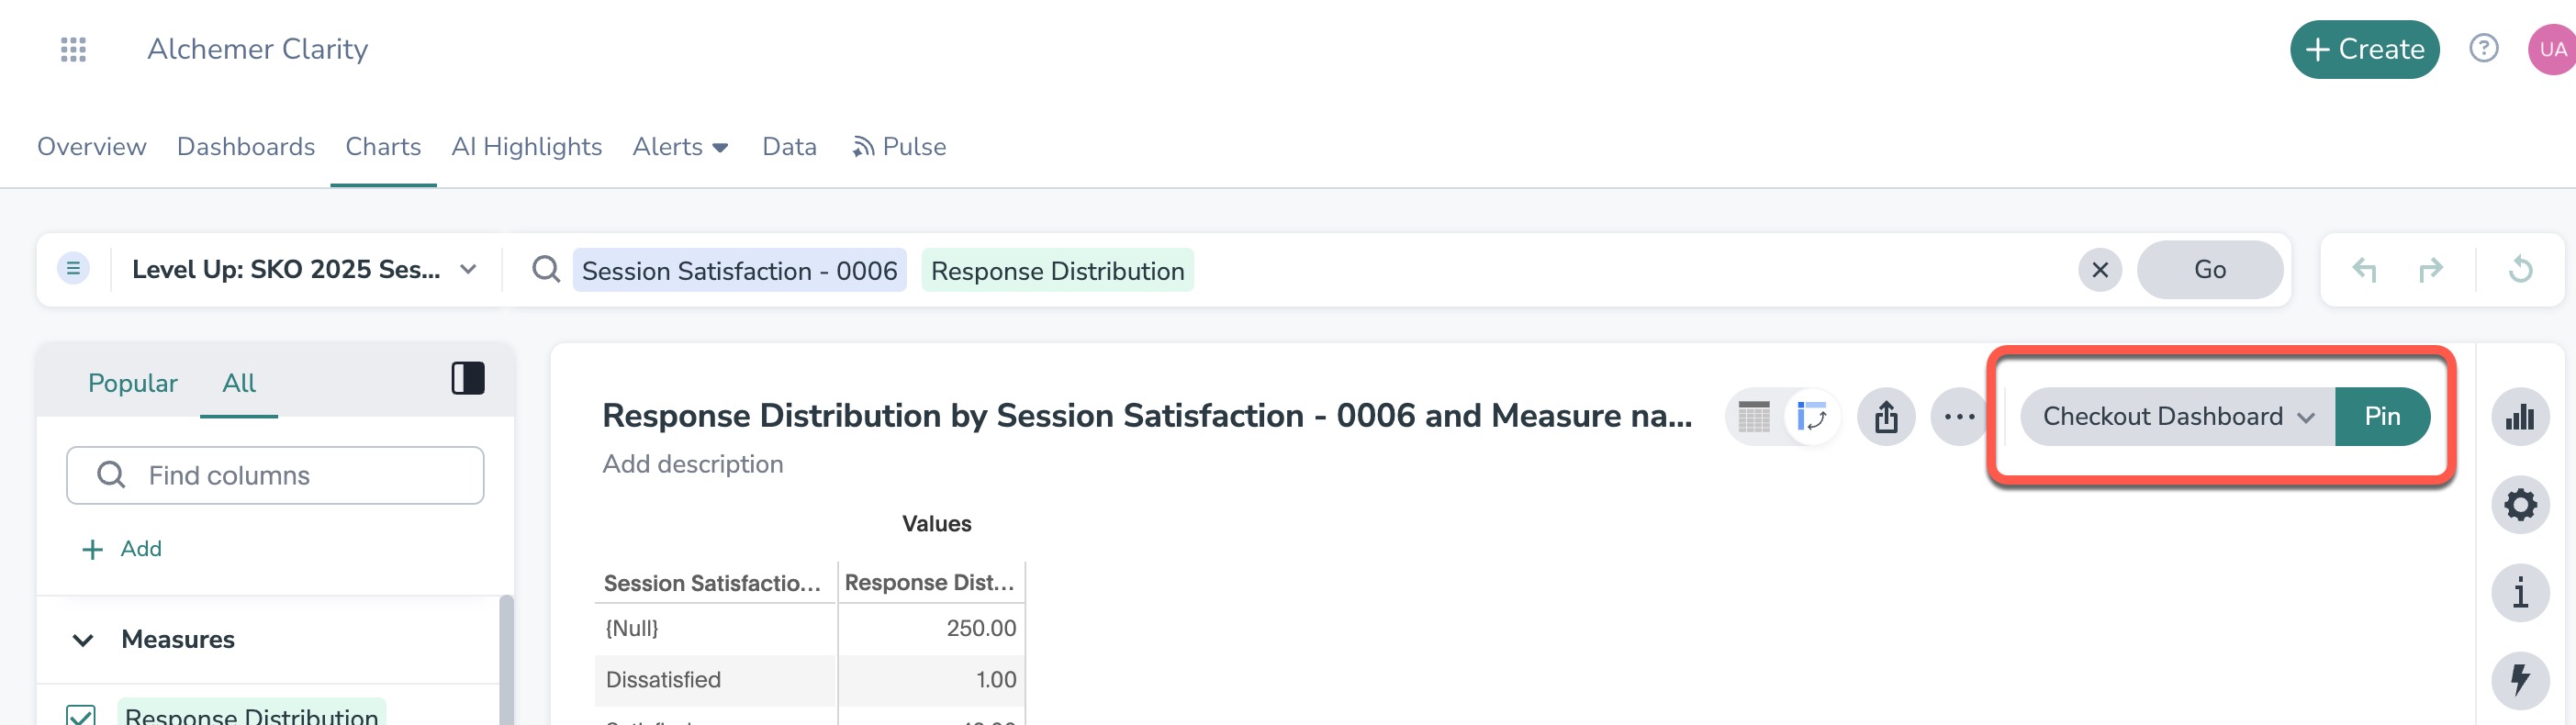
1. While viewing your Chart of interest, select the Pin button at the upper right of the Chart. The Pin button may have a Dashboard tab name next to it. Select Pin to quickly pin the Chart to that Dashboard or Dashboard tab. Select the dropdown menu to pin the Chart to a different Dashboard.
2. In the Pin to Dashboard dialog, select the name of the Dashboard you would like to add your Chart to.
3. If the Dashboard has multiple tabs, there is an arrow > symbol next to the Dashboard name. When you select the Dashboard, you can choose a tab to pin to, or create a new tab by selecting + Create tab.

4. Select Pin.
You can also select Create Dashboard at the top of the list of Dashboards to create a new Dashboard, then add your Chart to it.
Download a Dashboard
You can download a Dashboard as a PDF file, without having to download each visualization separately. Downloading a Dashboard works just as it would when downloading an Chart: simply select the More menu and select Download as PDF.
For more details, see Download a Dashboard as PDF.
Details about a Dashboard
You can view the following details about a Dashboard:
Name | Name of the Dashboard. |
Description | Short description of the Dashboard. |
Data source | Indicates the list of underlying data sources used to create the visualizations in the Dashboard. |
Author | Nameof the Dashboard author. |
Created on | Date that the Dashboard was created on. |
Last modified on | Date that the Dashboard was last modified on. |
Last modified by | Name of the user who last modified the Dashboard. |
View these details by selecting the More menu icon and selecting Show Dashboard details.

Edit a Dashboard
You must enter Edit mode to make changes to the Dashboard. This includes adding filters, adding tabs, and changing the layout. You do not need to enter edit mode to change the name of the Dashboard or Dashboard visualizations. Note that we improved the readability for the smallest size of Dashboard visualizations. Now, minimum-sized visualizations display only the chart, omitting the x- and y-axes and labels. You can hover over select data points to see the values.
To enter edit mode, select the Edit button at the upper right of the Dashboard. If this button is grayed out, you do not have edit privileges for the Dashboard. To resolve this, contact your administrator or the creator of the Dashboard.
Dashboard tabs
You may want to separate your Dashboard into multiple tabs, grouping certain visualizations together in each tab. For example, you may have a Sales Dashboard that contains top-level KPIs and more detailed charts. You can create a tab for the top-level KPIs for executives to view, and a tab for the more detailed charts that managers need to monitor. To add tabs, select the Edit button at the upper right of the Dashboard, and select + Add tab in the top menu.
Undo, Redo, and Reset Buttons
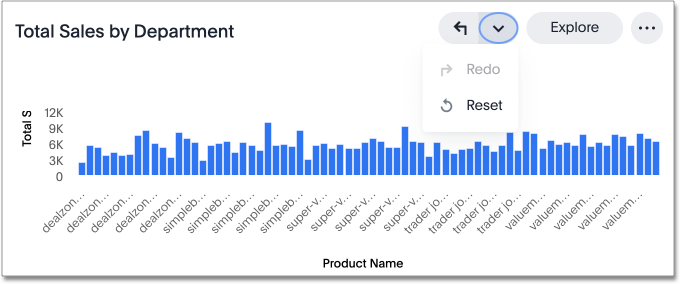
As you work with Dashboard visualizations, you may want to undo or redo an action. Use the in-product undo, redo, and reset buttons to reset or go back or forward 1 step each time you make a change in a search, saved Chart, or Dashboard visualization (for example, when you drill down, or sort). These buttons appear to the left of the Explore button in a Dashboard visualization. Note that the reset button is only available for saved Chartss and visualizations; it resets the Chart to its last saved state.
Other Dashboard actions
Other Dashboard actions include actions you normally perform on your search as well as actions that you can only perform on a Dashboard. You can see these options when you select the More menu icon in the upper-right corner of the Dashboard. Note that there are different options in the more menu for the Dashboard, depending on whether you are in view or edit mode.
You can see different options when you select the More menu icon in the upper-right corner of any Dashboard visualization. Note that there are different options in the more menu for the visualizations, depending on whether you are in view or edit mode.
If you make a change to a Dashboard in Edit mode, you must save your changes. Select the Save button in the top menu bar to make your changes permanent.