Parameters are useful for 'what-if' analysis, financial planning, cohort analysis, and so on. When you create parameters for your Worksheets, you guide users in their exploration of the data as they search on your Worksheets or use Dashboards based on your Worksheets. When you create parameters for your Charts, you empower yourself and other viewers of your Charts to run scenarios on the data in the Chart, using adjustable values.
Creating Parameters
There is no maximum number of parameters you can create for a single Worksheet or Chart. However, parameters don’t work across Worksheets or Charts. They only affect a single Worksheet or Chart.
Creating Worksheet parameters
To create a Worksheet parameter, follow these steps:
1. Navigate to the Worksheet to which you would like to add a parameter.
2. Select Edit Worksheet in the upper right corner.
3. In the Data panel on the left of your screen, select the + button that appears when you hover over the Parameters section.

4. The Create parameter dialog appears:
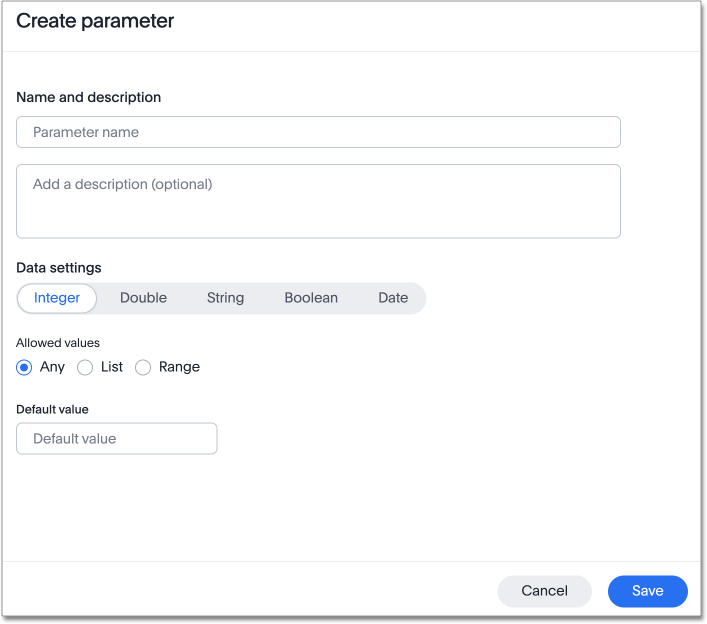
5. In the Parameter name text box, enter a name for your Parameter. This name should be unique for the object, and easy for users to understand.
6. Optionally, enter a description for the Parameter in the Add a description text box. Use this field to add additional information users might need before using this Parameter in their analysis. It is a best practice to use this field to specify the formulas this Parameter is used in, in addition to any other information you add.
7. Under Data settings, specify the data type the Parameter must be: Integer, Double, String, Boolean, or Date.
8. For integer, double, or date data types, specify the allowed values: Any, List, or Range. For the string data type, specify either Any or List.
| Any | Allows any value within the data type’s constraints. |
| List | Allows values only in the list you create. Enter a value in the Enter value… text box, and optionally enter what the value should display as in the Display as… text box. To add more values, select + Add row. To delete values, select the x to the right of the row the value is in.  |
| Range | Allows values only within the range you specify. In the Minimum value and Maximum value text boxes, specify the values the range begins and ends with.  |
9. For the boolean data type, optionally set custom names for true and false; for example, 0 and 1.
10. Set the default value for your Parameter. In the default value text box, enter the value this Parameter should default to. For the boolean data type, the Default value option is a dropdown. true and false are the only options.
11. Select Save.
12. Save your Worksheet. Select Save in the upper right corner.
Creating Chart Parameters
To create an Chart parameter, follow these steps:
1. Navigate to the Chart to which you would like to add a parameter.
2. In the Data panel on the left of your screen, navigate to the Category or A to Z view, click + Add, and select Parameter.
3. The Create parameter dialog appears:

4. In the Parameter name text box, enter a name for your Parameter. This name should be unique for the object, and easy for users to understand.
5. Optionally, enter a description for the Parameter in the Add a description text box. Use this field to add additional information users might need before using this Parameter in their analysis. It is a best practice to use this field to specify the formulas this Parameter is used in, in addition to any other information you add.
6. Under Data settings, specify the data type the Parameter must be: Integer, Double, String, Boolean, or Date.
7. For integer, double, or date data types, specify the allowed values: Any, List, or Range. For the string data type, specify either Any or List.
| Any | Allows any value within the data type’s constraints. |
| List | Allows values only in the list you create. Enter a value in the Enter value… text box, and optionally enter what the value should display as in the Display as… text box. To add more values, select + Add row. To delete values, select the x to the right of the row the value is in.  |
| Range | Allows values only within the range you specify. In the Minimum value and Maximum value text boxes, specify the values the range begins and ends with.  |
8. For the boolean data type, optionally set custom names for true and false; for example, 0 and 1.
9. Set the default value for your Parameter. In the default value text box, enter the value this Parameter should default to. For the boolean data type, the Default value option is a dropdown. true and false are the only options.
10. Select Save.
11. Save your Chart. Select the more options menu in the upper right corner, and select Save.
Editing and Deleting Parameters
To edit or delete existing parameters, follow these steps.
Editing and Deleting Worksheet parameters
1. Navigate to the Worksheet with the parameter you would like to edit or delete.
2. Select Edit Worksheet in the upper right corner.
3. In the Data panel on the left of your screen, select the Down arrow to the right of the Parameters section. This expands the list of parameters.
4. To edit a parameter, select the edit icon to the right of the parameter name.
Note that you may not be able to edit all fields, if the parameter is in use in formulas, Charts or Dashboard. For parameters that are in use, you can edit the following fields: Name, Description, Allowed values, and Default value. You can also add or delete values from a list parameter while it’s in use, or increase or decrease the minimum and maximum values in a range parameter.
To edit other fields, you must first remove it from these Charts and Dashboards. To see which Charts and Dashboards use the parameter, select View Details in the Edit parameter dialog that appears.
5. Make your changes, and select Save.
6. To delete a parameter, select the delete icon to the left of the parameter name.
Note that you may not be able to delete the parameter, if the parameter is in use in Charts or Dashboard. You must first remove it from these Charts and Dashboards. To see which Charts and Dashboard use the parameter, select View Details in the Delete this parameter dialog that appears.
7. Select Delete in the dialog that appears.
8. Save your Worksheet. Select Save in the upper right corner.
Editing and Deleting Chart Parameters
1. Navigate to the Charts with the parameter you would like to edit or delete.
2. In the Data panel on the left of your screen, select the arrow to the right of the Parameters section. This expands the list of parameters.
3. Click the parameter and select the more options menu
4. To change the parameter value, select Change value. Note that you can only change the parameter value if the parameter is not in use in a formula in the Chart.
5. To edit a parameter, select Edit.
Note that you may not be able to edit all fields, if the parameter is in use in a formula in the Chart. For parameters that are in use, you can edit the following fields: Name, Description, Allowed values, and Default value. You can also add or delete values from a list parameter while it’s in use, or increase or decrease the minimum and maximum values in a range parameter. To edit other fields, you must first remove the formula from the search.
6. Make your changes to the parameter, and select Save.
7. To delete a parameter, select Delete.
Note that you may not be able to delete the parameter, if the parameter is in use in a formula in the Chart. You must first remove the formula from the search.
8. Select Delete in the dialog that appears.
9. Save your Chart. Select the more options menu in the upper right corner, and select Save.